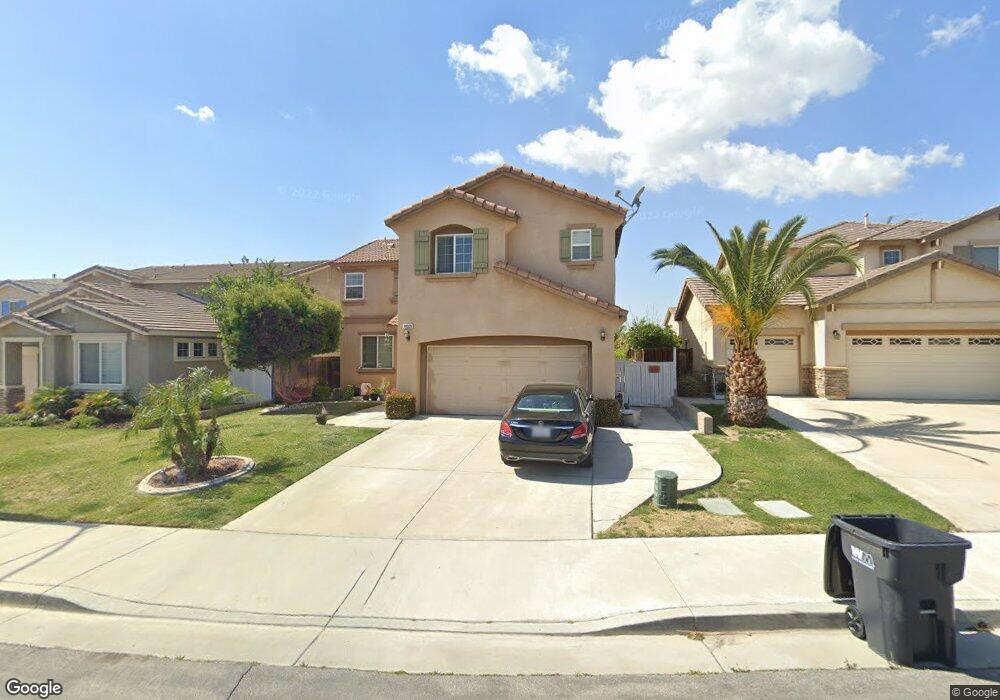
14329 Arborglenn Dr Moreno Valley, CA 92555
Rancho Belago NeighborhoodEstimated Value: $585,969 - $633,000
4
Beds
4
Baths
2,462
Sq Ft
$249/Sq Ft
Est. Value
About This Home
This home is located at 14329 Arborglenn Dr, Moreno Valley, CA 92555 and is currently estimated at $613,242, approximately $249 per square foot. 14329 Arborglenn Dr is a home located in Riverside County with nearby schools including Ridge Crest Elementary School, Landmark Middle, and Vista Del Lago High School.
Ownership History
Date
Name
Owned For
Owner Type
Purchase Details
Closed on
Sep 14, 2011
Sold by
Gmac Mortgage Llc
Bought by
Kumar Sudershan and Bala Sanju
Current Estimated Value
Home Financials for this Owner
Home Financials are based on the most recent Mortgage that was taken out on this home.
Original Mortgage
$175,437
Interest Rate
4.37%
Mortgage Type
FHA
Purchase Details
Closed on
Jun 2, 2011
Sold by
Bennett Demontre
Bought by
Gmac Mortgage Llc and Gmac Mortgage Corporation
Purchase Details
Closed on
Jan 27, 2005
Sold by
Moreno Valley Cactus Ranch Llc
Bought by
Bennett Demontre
Home Financials for this Owner
Home Financials are based on the most recent Mortgage that was taken out on this home.
Original Mortgage
$263,706
Interest Rate
5.5%
Mortgage Type
New Conventional
Create a Home Valuation Report for This Property
The Home Valuation Report is an in-depth analysis detailing your home's value as well as a comparison with similar homes in the area
Home Values in the Area
Average Home Value in this Area
Purchase History
| Date | Buyer | Sale Price | Title Company |
|---|---|---|---|
| Kumar Sudershan | $180,000 | Lsi Title Company Inc | |
| Gmac Mortgage Llc | $184,230 | Accommodation | |
| Bennett Demontre | $330,000 | Chicago Title |
Source: Public Records
Mortgage History
| Date | Status | Borrower | Loan Amount |
|---|---|---|---|
| Previous Owner | Kumar Sudershan | $175,437 | |
| Previous Owner | Bennett Demontre | $263,706 | |
| Closed | Bennett Demontre | $65,926 |
Source: Public Records
Tax History Compared to Growth
Tax History
| Year | Tax Paid | Tax Assessment Tax Assessment Total Assessment is a certain percentage of the fair market value that is determined by local assessors to be the total taxable value of land and additions on the property. | Land | Improvement |
|---|---|---|---|---|
| 2025 | $5,097 | $226,075 | $50,233 | $175,842 |
| 2023 | $5,097 | $217,299 | $48,284 | $169,015 |
| 2022 | $4,894 | $213,039 | $47,338 | $165,701 |
| 2021 | $4,830 | $208,862 | $46,410 | $162,452 |
| 2020 | $4,712 | $206,722 | $45,935 | $160,787 |
| 2019 | $4,710 | $202,670 | $45,035 | $157,635 |
| 2018 | $4,609 | $198,697 | $44,153 | $154,544 |
| 2017 | $4,541 | $194,802 | $43,288 | $151,514 |
| 2016 | $4,462 | $190,984 | $42,440 | $148,544 |
| 2015 | $4,478 | $188,116 | $41,803 | $146,313 |
| 2014 | $4,313 | $184,433 | $40,985 | $143,448 |
Source: Public Records
Map
Nearby Homes
- 28582 Buttercup Way
- 28140 Belleterre Ave
- 28196 Alessandro Blvd
- 28250 Grandview Dr
- 28320 Grandview Dr
- 14761 Pete Dye St
- 27943 Cactus Ave Unit A
- 27943 Aidan Cir
- 27753 Lafayette Way
- 28915 Alessandro Blvd
- 14921 Pete Dye St
- 14716 Grandview Dr
- 14614 Newburgh Rd
- 27757 Rockwood Ave
- 14925 Stephenson St
- 13891 Azure St
- 27964 John F. Kennedy Dr
- 28945 Williams Ave
- 28410 Forest Oaks Way
- 27573 Constance Ave
- 14339 Arborglenn Dr
- 14319 Arborglenn Dr
- 14349 Arborglenn Dr
- 14330 Morningside Dr
- 14340 Morningside Dr
- 14314 Morningside Dr
- 14303 Arborglenn Dr
- 14350 Morningside Dr
- 14298 Morningside Dr
- 14328 Arborglenn Dr
- 14318 Arborglenn Dr
- 14338 Arborglenn Dr
- 28350 Arborglenn Dr
- 14348 Arborglenn Dr
- 28366 Arborglenn Dr
- 14358 Arborglenn Dr
- 28339 Arborglenn Dr
- 28349 Arborglenn Dr
- 28329 Arborglenn Dr