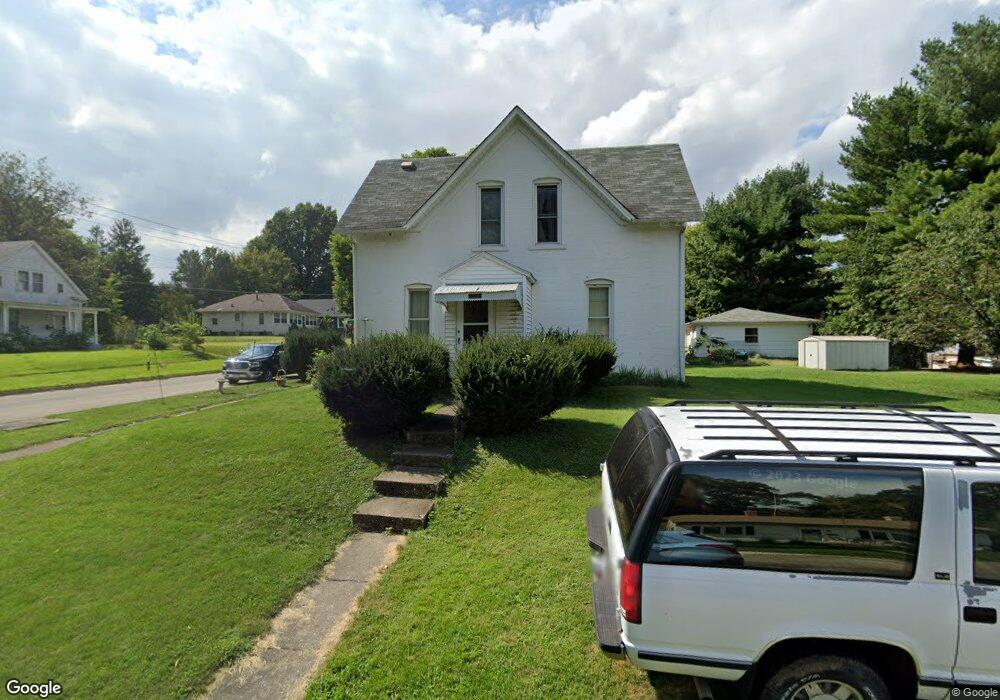
1433 S 6th St Burlington, IA 52601
Estimated Value: $88,000 - $115,000
3
Beds
1
Bath
1,302
Sq Ft
$76/Sq Ft
Est. Value
About This Home
This home is located at 1433 S 6th St, Burlington, IA 52601 and is currently estimated at $99,347, approximately $76 per square foot. 1433 S 6th St is a home located in Des Moines County with nearby schools including Burlington Community High School, Great River Christian School, and Burlington Notre Dame Catholic Elementary School.
Ownership History
Date
Name
Owned For
Owner Type
Purchase Details
Closed on
May 9, 2016
Sold by
Madsen Robert J and Scott Janis L
Bought by
Amenell Matthew T and Kelly Barbara J
Current Estimated Value
Home Financials for this Owner
Home Financials are based on the most recent Mortgage that was taken out on this home.
Original Mortgage
$50,000
Outstanding Balance
$39,591
Interest Rate
3.58%
Mortgage Type
Commercial
Estimated Equity
$59,756
Create a Home Valuation Report for This Property
The Home Valuation Report is an in-depth analysis detailing your home's value as well as a comparison with similar homes in the area
Home Values in the Area
Average Home Value in this Area
Purchase History
| Date | Buyer | Sale Price | Title Company |
|---|---|---|---|
| Amenell Matthew T | $50,000 | None Available |
Source: Public Records
Mortgage History
| Date | Status | Borrower | Loan Amount |
|---|---|---|---|
| Open | Amenell Matthew T | $50,000 |
Source: Public Records
Tax History Compared to Growth
Tax History
| Year | Tax Paid | Tax Assessment Tax Assessment Total Assessment is a certain percentage of the fair market value that is determined by local assessors to be the total taxable value of land and additions on the property. | Land | Improvement |
|---|---|---|---|---|
| 2025 | $1,412 | $73,500 | $12,400 | $61,100 |
| 2024 | $1,412 | $72,700 | $12,400 | $60,300 |
| 2023 | $1,062 | $72,700 | $12,400 | $60,300 |
| 2022 | $1,080 | $53,000 | $12,400 | $40,600 |
| 2021 | $1,080 | $53,000 | $12,400 | $40,600 |
| 2020 | $1,150 | $53,000 | $12,400 | $40,600 |
| 2019 | $952 | $53,000 | $12,400 | $40,600 |
| 2018 | $954 | $41,400 | $15,000 | $26,400 |
| 2017 | $954 | $40,600 | $0 | $0 |
| 2016 | $650 | $40,600 | $0 | $0 |
| 2015 | $650 | $40,600 | $0 | $0 |
| 2014 | $660 | $38,900 | $0 | $0 |
Source: Public Records
Map
Nearby Homes