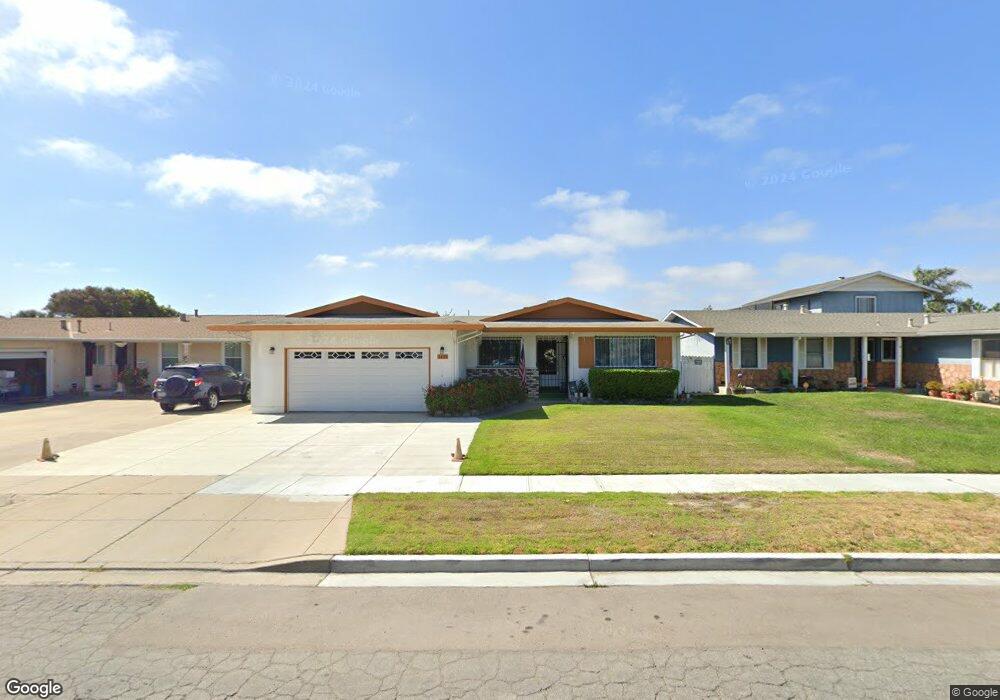
1433 Shawnee Way Salinas, CA 93906
Northridge NeighborhoodEstimated Value: $675,559 - $705,000
3
Beds
2
Baths
1,441
Sq Ft
$479/Sq Ft
Est. Value
About This Home
This home is located at 1433 Shawnee Way, Salinas, CA 93906 and is currently estimated at $690,140, approximately $478 per square foot. 1433 Shawnee Way is a home located in Monterey County with nearby schools including Henry F. Kammann Elementary School, Boronda Meadows Elementary School, and Harden Middle School.
Ownership History
Date
Name
Owned For
Owner Type
Purchase Details
Closed on
Jan 18, 2002
Sold by
Holt Fred D and Holt Nancy L
Bought by
Holt Fred Donald and Holt Nancy Loretha
Current Estimated Value
Home Financials for this Owner
Home Financials are based on the most recent Mortgage that was taken out on this home.
Original Mortgage
$66,250
Interest Rate
6.84%
Mortgage Type
Stand Alone First
Purchase Details
Closed on
Jan 4, 2002
Sold by
Holt Fred Donald and Holt Nancy Loretha
Bought by
Holt Fred D and Holt Nancy L
Home Financials for this Owner
Home Financials are based on the most recent Mortgage that was taken out on this home.
Original Mortgage
$66,250
Interest Rate
6.84%
Mortgage Type
Stand Alone First
Purchase Details
Closed on
Aug 2, 1995
Sold by
Holt Fred D and Holt Nancy L
Bought by
Holt Fred Donald and Holt Nancy Loretha
Purchase Details
Closed on
Jun 12, 1995
Sold by
Holt Fred D and Holt Nancy L
Bought by
Hold Fred Donald and Holt Nancy Loretha
Create a Home Valuation Report for This Property
The Home Valuation Report is an in-depth analysis detailing your home's value as well as a comparison with similar homes in the area
Home Values in the Area
Average Home Value in this Area
Purchase History
| Date | Buyer | Sale Price | Title Company |
|---|---|---|---|
| Holt Fred Donald | -- | -- | |
| Holt Fred D | -- | Chicago Title Co | |
| Holt Fred Donald | -- | -- | |
| Hold Fred Donald | -- | -- |
Source: Public Records
Mortgage History
| Date | Status | Borrower | Loan Amount |
|---|---|---|---|
| Closed | Holt Fred D | $66,250 |
Source: Public Records
Tax History Compared to Growth
Tax History
| Year | Tax Paid | Tax Assessment Tax Assessment Total Assessment is a certain percentage of the fair market value that is determined by local assessors to be the total taxable value of land and additions on the property. | Land | Improvement |
|---|---|---|---|---|
| 2025 | $59 | $83,422 | $16,959 | $66,463 |
| 2024 | $59 | $81,787 | $16,627 | $65,160 |
| 2023 | $58 | $80,184 | $16,301 | $63,883 |
| 2022 | $53 | $78,613 | $15,982 | $62,631 |
| 2021 | $52 | $77,072 | $15,669 | $61,403 |
| 2020 | $51 | $76,283 | $15,509 | $60,774 |
| 2019 | $48 | $74,788 | $15,205 | $59,583 |
| 2018 | $44 | $73,322 | $14,907 | $58,415 |
| 2017 | $44 | $71,885 | $14,615 | $57,270 |
| 2016 | $43 | $70,477 | $14,329 | $56,148 |
| 2015 | $42 | $69,419 | $14,114 | $55,305 |
| 2014 | $43 | $68,060 | $13,838 | $54,222 |
Source: Public Records
Map
Nearby Homes
- 572 Inca Way
- 1521 Ebro Cir
- 1518 Duran Cir
- 1515 Aragon Cir
- 1634 Cherokee Dr
- 1635 Cherokee Dr
- 344 Pueblo Dr
- 1607 Cuevas Cir
- 1867 Cherokee Dr Unit 1
- 1883 Cherokee Dr Unit 3
- 1868 Cherokee Dr Unit 1
- 730 N Main St
- 1807 Cherokee Dr Unit 3
- 1221 Parkside St
- 1170 Tyler St
- 684 Alvarado Ct
- 221 Tapadero St
- 1043 Heather Dr
- 55 San Juan Grade Rd Unit 17
- 55 San Juan Grade Rd Unit 95
- 1439 Shawnee Way
- 1425 Shawnee Way
- 1417 Shawnee Way
- 1441 Shawnee Way
- 487 Comanche Way
- 1409 Shawnee Way
- 1447 Shawnee Way
- 488 Comanche Way
- 588 Inca Way
- 479 Comanche Way
- 480 Comanche Way
- 1455 Shawnee Way
- 1401 Shawnee Way
- 485 Seminole Way
- 580 Inca Way
- 471 Comanche Way
- 479 Seminole Way
- 472 Comanche Way Unit 5
- 599 Inca Way
- 1463 Shawnee Way