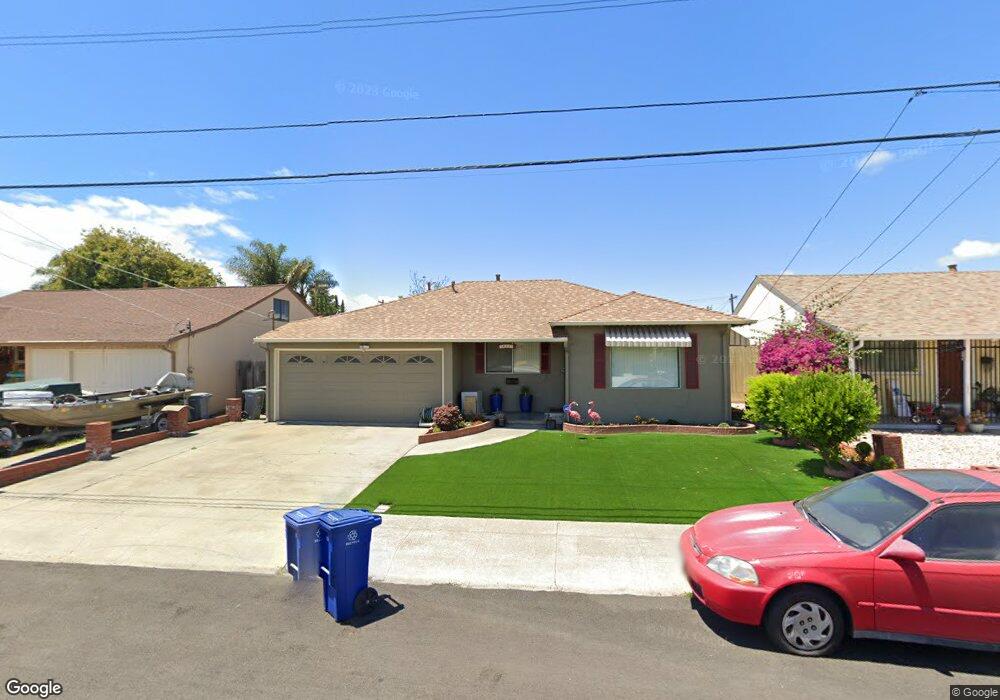
14331 Acacia St San Leandro, CA 94579
Washington Manor-Bonaire NeighborhoodEstimated Value: $756,000 - $945,000
3
Beds
2
Baths
1,225
Sq Ft
$683/Sq Ft
Est. Value
About This Home
This home is located at 14331 Acacia St, San Leandro, CA 94579 and is currently estimated at $836,869, approximately $683 per square foot. 14331 Acacia St is a home located in Alameda County with nearby schools including Madison Elementary School, John Muir Middle School, and San Leandro High School.
Ownership History
Date
Name
Owned For
Owner Type
Purchase Details
Closed on
Aug 17, 2016
Sold by
Mendenhall Terry L and Mendenhall Kathleen F
Bought by
Nguyen Linh Duy and Huynh Huong Thien
Current Estimated Value
Home Financials for this Owner
Home Financials are based on the most recent Mortgage that was taken out on this home.
Original Mortgage
$395,000
Outstanding Balance
$314,450
Interest Rate
3.41%
Mortgage Type
New Conventional
Estimated Equity
$522,419
Purchase Details
Closed on
Mar 28, 2006
Sold by
Mendenhall Terry L
Bought by
Mendenhall Terry L and Mendenhall Kathleen F
Purchase Details
Closed on
Feb 16, 2005
Sold by
Edward Mendenhall Terry Lee and Edward John
Bought by
Mendenhall Terry Lee
Purchase Details
Closed on
Jan 5, 1994
Sold by
Mendenhall John Edward and Mendenhall Orma Jones
Bought by
Mendenhall John Edward and Mendenhall Orma Jones
Create a Home Valuation Report for This Property
The Home Valuation Report is an in-depth analysis detailing your home's value as well as a comparison with similar homes in the area
Home Values in the Area
Average Home Value in this Area
Purchase History
| Date | Buyer | Sale Price | Title Company |
|---|---|---|---|
| Nguyen Linh Duy | $575,000 | Old Republic Title Company | |
| Mendenhall Terry L | -- | None Available | |
| Mendenhall Terry L | -- | None Available | |
| Mendenhall Terry Lee | -- | None Available | |
| Mendenhall John Edward | -- | -- |
Source: Public Records
Mortgage History
| Date | Status | Borrower | Loan Amount |
|---|---|---|---|
| Open | Nguyen Linh Duy | $395,000 |
Source: Public Records
Tax History Compared to Growth
Tax History
| Year | Tax Paid | Tax Assessment Tax Assessment Total Assessment is a certain percentage of the fair market value that is determined by local assessors to be the total taxable value of land and additions on the property. | Land | Improvement |
|---|---|---|---|---|
| 2025 | $8,855 | $660,322 | $203,098 | $464,224 |
| 2024 | $8,855 | $647,240 | $199,116 | $455,124 |
| 2023 | $8,790 | $641,412 | $195,212 | $446,200 |
| 2022 | $8,545 | $621,837 | $191,385 | $437,452 |
| 2021 | $8,278 | $609,509 | $187,633 | $428,876 |
| 2020 | $8,060 | $610,190 | $185,710 | $424,480 |
| 2019 | $7,823 | $598,230 | $182,070 | $416,160 |
| 2018 | $7,623 | $586,500 | $178,500 | $408,000 |
| 2017 | $7,476 | $575,000 | $175,000 | $400,000 |
| 2016 | $1,523 | $81,485 | $36,657 | $44,828 |
| 2015 | $1,496 | $80,260 | $36,106 | $44,154 |
| 2014 | $1,476 | $78,689 | $35,399 | $43,290 |
Source: Public Records
Map
Nearby Homes
- 1803 Cedar Ave
- 14666 Wiley St
- 1875 Willow Ave
- 1315 Mersey Ave
- 3419 Del Valle Cir
- 3411 Del Monte Way
- 14820 Crosby St
- 3672 Del Monte Way
- 774 Hamlin Way
- 3811 Yorkshire St Unit 2
- 3847 Yorkshire St Unit 8
- 15102 Chapel Ct
- 2127 Fairway Dr
- 14075 Doolittle Dr
- 585 Majestic Way Unit 40
- 1364 Linton St
- 14617 Doolittle Dr
- 2262 Bermuda Ave
- 14587 Doolittle Dr
- 15067 Churchill St
- 14323 Acacia St
- 14345 Acacia St
- 14344 Birch St
- 14369 Acacia St
- 14326 Birch St
- 14350 Birch St
- 14319 Acacia St
- 1502 Cedar Ave
- 14378 Birch St
- 14334 Acacia St
- 14346 Acacia St
- 14322 Acacia St
- 14387 Acacia St
- 14318 Birch St
- 14310 Acacia St
- 14368 Acacia St
- 14382 Birch St
- 14393 Acacia St
- 14380 Acacia St
- 14396 Birch St