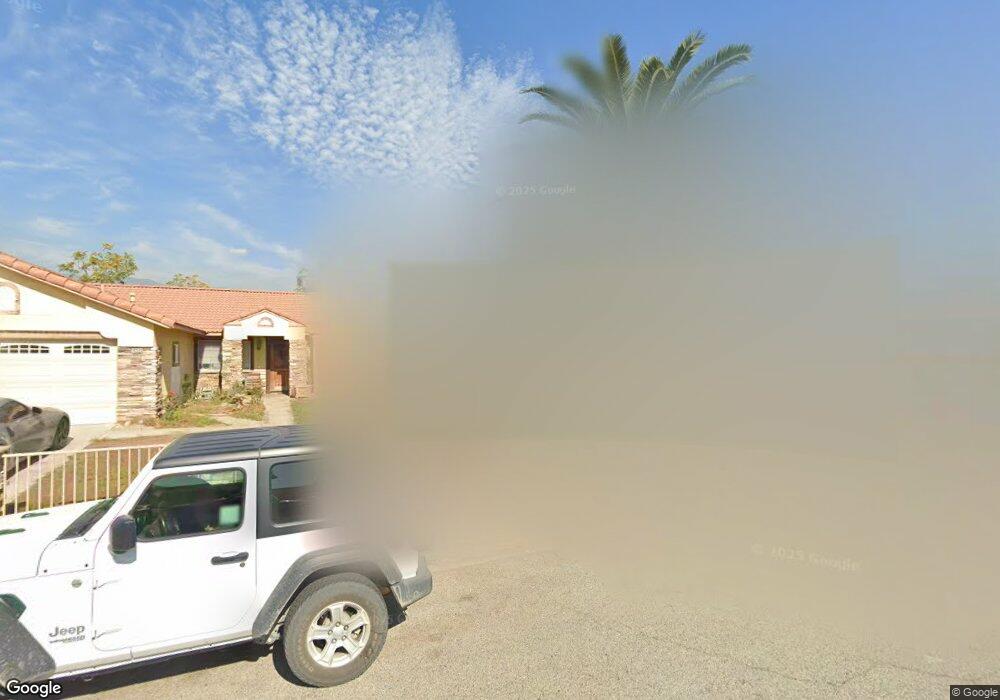
14334 Upas Ct Fontana, CA 92335
Estimated Value: $626,934 - $664,000
4
Beds
2
Baths
1,564
Sq Ft
$417/Sq Ft
Est. Value
About This Home
This home is located at 14334 Upas Ct, Fontana, CA 92335 and is currently estimated at $652,734, approximately $417 per square foot. 14334 Upas Ct is a home located in San Bernardino County with nearby schools including Almond Elementary School, Sequoia Middle School, and Summit High School.
Ownership History
Date
Name
Owned For
Owner Type
Purchase Details
Closed on
Jul 11, 1997
Sold by
Norwest Mtg Inc
Bought by
Gaitan Marvin Teodoro and Gaitan Luz Marina
Current Estimated Value
Home Financials for this Owner
Home Financials are based on the most recent Mortgage that was taken out on this home.
Original Mortgage
$88,000
Outstanding Balance
$12,700
Interest Rate
7.58%
Estimated Equity
$640,034
Purchase Details
Closed on
Apr 24, 1997
Sold by
Alonso Jose Refugio
Bought by
Norwest Mtg Inc
Purchase Details
Closed on
Nov 29, 1996
Sold by
Alonso Jose Refugio
Bought by
New Haven Corp
Purchase Details
Closed on
May 10, 1995
Sold by
Jerry Lavitt Inc
Bought by
Alonzo Jose Refugio and Gonzalez Felipe
Home Financials for this Owner
Home Financials are based on the most recent Mortgage that was taken out on this home.
Original Mortgage
$133,282
Interest Rate
7.88%
Mortgage Type
FHA
Create a Home Valuation Report for This Property
The Home Valuation Report is an in-depth analysis detailing your home's value as well as a comparison with similar homes in the area
Home Values in the Area
Average Home Value in this Area
Purchase History
| Date | Buyer | Sale Price | Title Company |
|---|---|---|---|
| Gaitan Marvin Teodoro | $110,000 | Old Republic Title Company | |
| Norwest Mtg Inc | $140,707 | Ati Title Company | |
| New Haven Corp | -- | -- | |
| Alonzo Jose Refugio | $135,000 | Orange Coast Title Co |
Source: Public Records
Mortgage History
| Date | Status | Borrower | Loan Amount |
|---|---|---|---|
| Open | Gaitan Marvin Teodoro | $88,000 | |
| Previous Owner | Alonzo Jose Refugio | $133,282 | |
| Closed | Gaitan Marvin Teodoro | $16,500 |
Source: Public Records
Tax History Compared to Growth
Tax History
| Year | Tax Paid | Tax Assessment Tax Assessment Total Assessment is a certain percentage of the fair market value that is determined by local assessors to be the total taxable value of land and additions on the property. | Land | Improvement |
|---|---|---|---|---|
| 2025 | $1,920 | $190,840 | $39,921 | $150,919 |
| 2024 | $1,920 | $187,098 | $39,138 | $147,960 |
| 2023 | $1,869 | $183,430 | $38,371 | $145,059 |
| 2022 | $1,860 | $179,834 | $37,619 | $142,215 |
| 2021 | $4,990 | $176,307 | $36,881 | $139,426 |
| 2020 | $4,985 | $174,499 | $36,503 | $137,996 |
| 2019 | $4,928 | $171,077 | $35,787 | $135,290 |
| 2018 | $4,953 | $167,722 | $35,085 | $132,637 |
| 2017 | $4,902 | $164,433 | $34,397 | $130,036 |
| 2016 | $1,756 | $161,209 | $33,723 | $127,486 |
| 2015 | $1,733 | $158,787 | $33,216 | $125,571 |
| 2014 | $1,727 | $155,676 | $32,565 | $123,111 |
Source: Public Records
Map
Nearby Homes
- 14418 Bing Ave
- 8316 Reseda Ave
- 14412 Bing Ave
- 14408 Bing Ave
- 14424 Bing Ave
- 14428 Bing Ave
- 14432 Bing Ave
- 14718 Valencia Ave
- 13868 Lexus Ln
- 14093 Marbella St
- 14783 Ivy Ave
- 14219 Point Loma St
- 8043 Tuscany St
- 13841 Cobblestone Ct
- 14084 Rothchild Ct
- 13681 Lexus Ln
- 14028 Yorktown Ct
- 8051 Mcgregor Ct
- 8221 Ilex St Unit 23
- 8221 Ilex St Unit 10