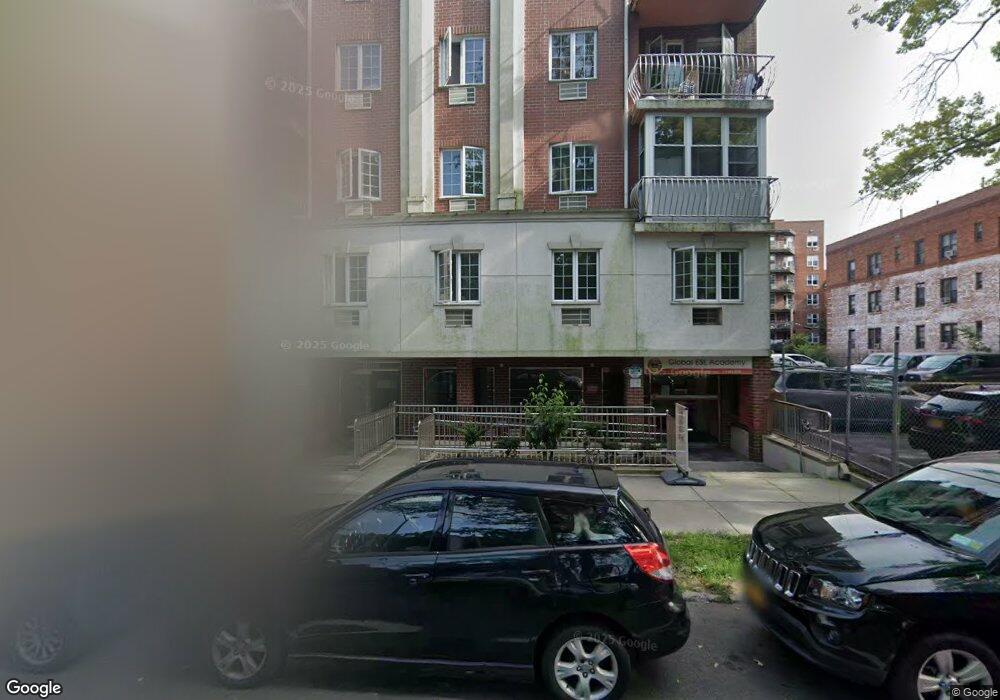
14336 37th Ave Unit 4B Flushing, NY 11354
Flushing NeighborhoodEstimated Value: $485,000 - $551,000
--
Bed
--
Bath
688
Sq Ft
$749/Sq Ft
Est. Value
About This Home
This home is located at 14336 37th Ave Unit 4B, Flushing, NY 11354 and is currently estimated at $515,544, approximately $749 per square foot. 14336 37th Ave Unit 4B is a home located in Queens County with nearby schools including P.S. 107 Thomas A Dooley, I.S. 25 Adrien Block, and Flushing High School.
Ownership History
Date
Name
Owned For
Owner Type
Purchase Details
Closed on
May 31, 2024
Sold by
Leung Eunice Mei Yan and Leung Ka Kin
Bought by
Leung Eunice Mei Yan and Leung Ka Kin
Current Estimated Value
Purchase Details
Closed on
Nov 5, 2021
Sold by
Yang Susan
Bought by
Leung Eunice Mei Yan and Leung Ka Kin
Home Financials for this Owner
Home Financials are based on the most recent Mortgage that was taken out on this home.
Original Mortgage
$360,000
Outstanding Balance
$330,152
Interest Rate
3.05%
Mortgage Type
Purchase Money Mortgage
Estimated Equity
$185,392
Purchase Details
Closed on
Jan 29, 2020
Sold by
Ni Bili and Yang Chao Young
Bought by
Yang Susan
Purchase Details
Closed on
Mar 12, 2019
Sold by
Young Ni Bili and Young Yang Chao
Bought by
Young Ni Bili and Young Yang Chao
Purchase Details
Closed on
Mar 10, 2011
Sold by
Han Kinam
Bought by
Ni Bi Li and Yang Chao Young
Purchase Details
Closed on
Jan 24, 2011
Sold by
37 Parsons Corp
Bought by
Han Kinam
Create a Home Valuation Report for This Property
The Home Valuation Report is an in-depth analysis detailing your home's value as well as a comparison with similar homes in the area
Home Values in the Area
Average Home Value in this Area
Purchase History
| Date | Buyer | Sale Price | Title Company |
|---|---|---|---|
| Leung Eunice Mei Yan | $50,000 | -- | |
| Leung Eunice Mei Yan | $480,000 | -- | |
| Yang Susan | -- | -- | |
| Young Ni Bili | -- | -- | |
| Ni Bi Li | $238,000 | -- | |
| Han Kinam | -- | -- |
Source: Public Records
Mortgage History
| Date | Status | Borrower | Loan Amount |
|---|---|---|---|
| Open | Leung Eunice Mei Yan | $360,000 |
Source: Public Records
Tax History Compared to Growth
Tax History
| Year | Tax Paid | Tax Assessment Tax Assessment Total Assessment is a certain percentage of the fair market value that is determined by local assessors to be the total taxable value of land and additions on the property. | Land | Improvement |
|---|---|---|---|---|
| 2025 | $7,748 | $62,581 | $10,901 | $51,680 |
| 2024 | $7,748 | $61,976 | $10,697 | $51,279 |
| 2023 | $6,166 | $61,463 | $10,494 | $50,969 |
| 2022 | $4,479 | $63,009 | $10,901 | $52,108 |
| 2021 | $2,831 | $56,565 | $10,901 | $45,664 |
| 2020 | $1,528 | $63,152 | $9,884 | $53,268 |
| 2019 | $94 | $61,171 | $9,884 | $51,287 |
| 2018 | $95 | $51,086 | $9,883 | $41,203 |
| 2017 | $95 | $48,071 | $9,884 | $38,187 |
| 2016 | $97 | $48,071 | $9,884 | $38,187 |
| 2015 | -- | $43,369 | $9,884 | $33,485 |
| 2014 | -- | $41,796 | $9,884 | $31,912 |
Source: Public Records
Map
Nearby Homes
- 143-36 37th Ave Unit 5
- 38-20 Parsons Blvd Unit 318
- 38-20 Parsons Blvd Unit 604
- 38-20 Parsons Blvd Unit 530
- 38-20 Parsons Blvd Unit 529
- 38-20 Parsons Blvd Unit 525
- 38-20 Parsons Blvd Unit 409
- 38-20 Parsons Blvd Unit 404
- 38-20 Parsons Blvd Unit 327
- 38-20 Parsons Blvd Unit 308
- 38-20 Parsons Blvd Unit 306
- 38-20 Parsons Blvd Unit 209
- 38-20 Parsons Blvd Unit 425
- 38-20 Parsons Blvd Unit 709
- 38-20 Parsons Blvd Unit 708
- 38-20 Parsons Blvd Unit 704
- 38-20 Parsons Blvd Unit 702
- 38-20 Parsons Blvd Unit 608
- 38-20 Parsons Blvd Unit 433
- 38-20 Parsons Blvd Unit 431
- 14336 37th Ave Unit 4C
- 14336 37th Ave Unit 1B
- 14336 37th Ave Unit 1A
- 14336 37th Ave Unit 5C
- 14336 37th Ave Unit 5B
- 14336 37th Ave Unit 5A
- 14336 37th Ave Unit 4A
- 14336 37th Ave Unit 3D
- 14336 37th Ave Unit 3C
- 14336 37th Ave Unit 3B
- 14336 37th Ave Unit 3A
- 14336 37th Ave Unit 2D
- 14336 37th Ave Unit 2C
- 14336 37th Ave Unit 2B
- 14336 37th Ave Unit 2A
- 14336 37th Ave Unit 1D
- 14336 37th Ave Unit 1C
- 14336 37th Ave Unit 4D
- 14336 37th Ave Unit PS10
- 14336 37th Ave Unit PS4