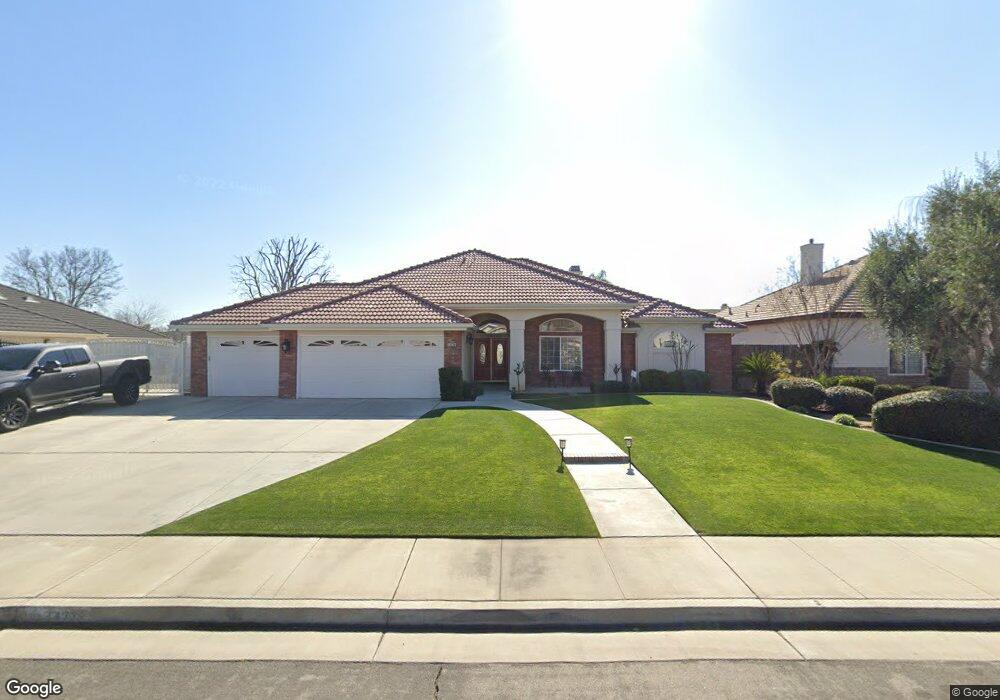
14339 Searspoint Ave Bakersfield, CA 93314
Estimated Value: $641,342 - $730,000
3
Beds
3
Baths
2,912
Sq Ft
$236/Sq Ft
Est. Value
About This Home
This home is located at 14339 Searspoint Ave, Bakersfield, CA 93314 and is currently estimated at $686,086, approximately $235 per square foot. 14339 Searspoint Ave is a home located in Kern County with nearby schools including Patriot Elementary School, Freedom Middle School, and Frontier High School.
Ownership History
Date
Name
Owned For
Owner Type
Purchase Details
Closed on
Apr 15, 2009
Sold by
Turner Richard and Turner Kathleen C
Bought by
Turner Richard and Turner Kathleen C
Current Estimated Value
Home Financials for this Owner
Home Financials are based on the most recent Mortgage that was taken out on this home.
Original Mortgage
$275,000
Interest Rate
4.8%
Mortgage Type
New Conventional
Purchase Details
Closed on
May 24, 2007
Sold by
Turner Richard D and Turner Kathleen C
Bought by
Turner Richard and Turner Kathleen C
Purchase Details
Closed on
Jan 2, 2002
Sold by
Rosedale Builders Inc
Bought by
Turner Richard D and Turner Kathleen C
Home Financials for this Owner
Home Financials are based on the most recent Mortgage that was taken out on this home.
Original Mortgage
$241,000
Interest Rate
7.13%
Create a Home Valuation Report for This Property
The Home Valuation Report is an in-depth analysis detailing your home's value as well as a comparison with similar homes in the area
Home Values in the Area
Average Home Value in this Area
Purchase History
| Date | Buyer | Sale Price | Title Company |
|---|---|---|---|
| Turner Richard | -- | Ticor Title Company Of Ca | |
| Turner Richard | -- | None Available | |
| Turner Richard D | $257,500 | First American Title Co |
Source: Public Records
Mortgage History
| Date | Status | Borrower | Loan Amount |
|---|---|---|---|
| Closed | Turner Richard | $275,000 | |
| Closed | Turner Richard D | $241,000 |
Source: Public Records
Tax History Compared to Growth
Tax History
| Year | Tax Paid | Tax Assessment Tax Assessment Total Assessment is a certain percentage of the fair market value that is determined by local assessors to be the total taxable value of land and additions on the property. | Land | Improvement |
|---|---|---|---|---|
| 2025 | $6,005 | $406,429 | $73,854 | $332,575 |
| 2024 | $5,844 | $398,461 | $72,406 | $326,055 |
| 2023 | $5,844 | $390,650 | $70,987 | $319,663 |
| 2022 | $5,727 | $382,992 | $69,596 | $313,396 |
| 2021 | $5,598 | $375,484 | $68,232 | $307,252 |
| 2020 | $5,519 | $371,636 | $67,533 | $304,103 |
| 2019 | $5,489 | $371,636 | $67,533 | $304,103 |
| 2018 | $5,260 | $357,207 | $64,911 | $292,296 |
| 2017 | $5,242 | $350,205 | $63,639 | $286,566 |
| 2016 | $4,783 | $343,340 | $62,392 | $280,948 |
| 2015 | $4,730 | $338,184 | $61,455 | $276,729 |
| 2014 | $4,627 | $331,561 | $60,252 | $271,309 |
Source: Public Records
Map
Nearby Homes
- 14012 Cedar Creek Ave
- 14508 Plumeria Ct
- 14631 Blue Stream Ave
- 14822 Plumeria Ct
- 14014 Santa fe Ct
- 14507 Evadell Ct
- 13946 Santa fe Ct
- 12403 Hageman Rd
- 12701 Hageman Rd
- 15031 Rye Field Dr
- 15002 Southernwood Ave
- 3849 Jenkins Rd
- 14301 Shady Tree Ct
- 14300 Shady Tree Ct
- 15020 Cotton Blossom Ave
- 3616 Three Bars St
- 3611 Jenkins Rd
- 3408 Shauna Marie St
- 14526 Pams Way
- 14808 Glover Ct
- 14323 Searspoint Ave
- 14361 Searspoint Ave
- 14338 Cedar Creek Ave
- 14322 Cedar Creek Ave
- 14362 Cedar Creek Ave
- 14307 Searspoint Ave Unit 1
- 14334 Searspoint Ave
- 14419 Searspoint Ave
- 14352 Searspoint Ave
- 14318 Searspoint Ave
- 14306 Cedar Creek Ave
- 14416 Cedar Creek Ave
- 14406 Searspoint Ave
- 14249 Searspoint Ave
- 14248 Cedar Creek Ave
- 14445 Searspoint Ave
- 14250 Searspoint Ave Unit 1
- 14335 Austin Creek Ave
- 14353 Austin Creek Ave
- 14319 Austin Creek Ave