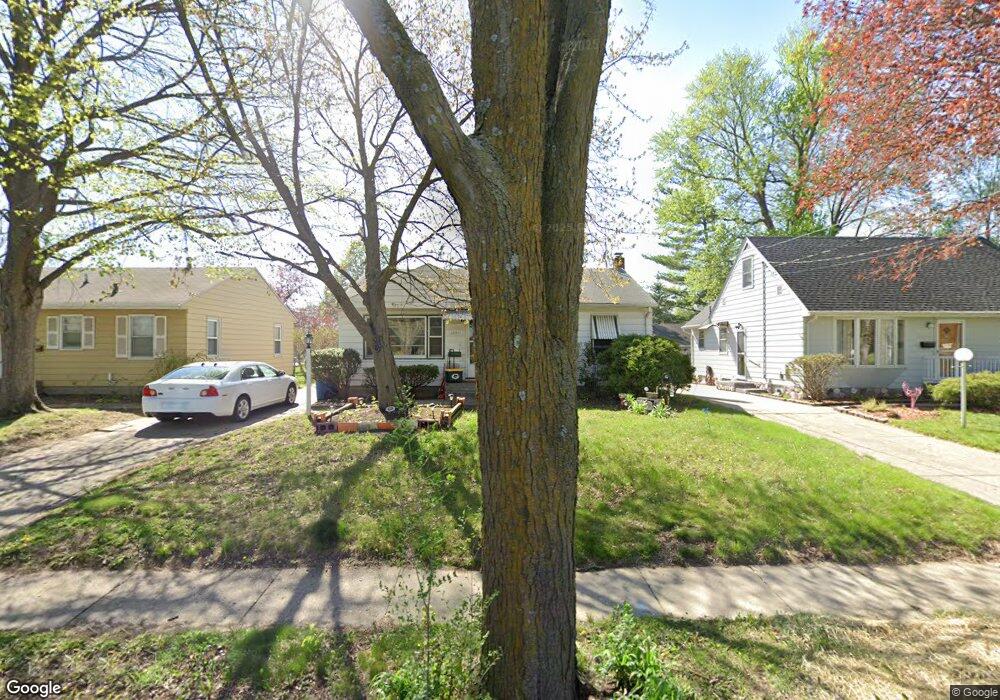
1434 55th St Des Moines, IA 50311
Merle Hay NeighborhoodEstimated Value: $188,000 - $214,923
3
Beds
1
Bath
896
Sq Ft
$229/Sq Ft
Est. Value
About This Home
This home is located at 1434 55th St, Des Moines, IA 50311 and is currently estimated at $205,481, approximately $229 per square foot. 1434 55th St is a home located in Polk County with nearby schools including Windsor Elementary School, Merrill Middle School, and Roosevelt High School.
Ownership History
Date
Name
Owned For
Owner Type
Purchase Details
Closed on
Sep 10, 2012
Sold by
Bird Richard E and Bird Sheila A
Bought by
Christensen Teresa Lynn
Current Estimated Value
Purchase Details
Closed on
Jun 17, 2005
Sold by
Platner Ryan Douglas
Bought by
Bird Richard E and Bird Sheila A
Purchase Details
Closed on
May 27, 2003
Sold by
Daniels Janice Elaine and Daniels Russell
Bought by
Platner Ryan Douglas
Home Financials for this Owner
Home Financials are based on the most recent Mortgage that was taken out on this home.
Original Mortgage
$83,600
Interest Rate
4.37%
Mortgage Type
Purchase Money Mortgage
Create a Home Valuation Report for This Property
The Home Valuation Report is an in-depth analysis detailing your home's value as well as a comparison with similar homes in the area
Home Values in the Area
Average Home Value in this Area
Purchase History
| Date | Buyer | Sale Price | Title Company |
|---|---|---|---|
| Christensen Teresa Lynn | -- | None Available | |
| Bird Richard E | $117,500 | -- | |
| Platner Ryan Douglas | $104,000 | -- |
Source: Public Records
Mortgage History
| Date | Status | Borrower | Loan Amount |
|---|---|---|---|
| Previous Owner | Platner Ryan Douglas | $83,600 |
Source: Public Records
Tax History
| Year | Tax Paid | Tax Assessment Tax Assessment Total Assessment is a certain percentage of the fair market value that is determined by local assessors to be the total taxable value of land and additions on the property. | Land | Improvement |
|---|---|---|---|---|
| 2025 | $3,306 | $198,900 | $40,700 | $158,200 |
| 2024 | $3,306 | $178,500 | $35,800 | $142,700 |
| 2023 | $3,440 | $178,500 | $35,800 | $142,700 |
| 2022 | $3,410 | $154,800 | $32,300 | $122,500 |
| 2021 | $3,256 | $154,800 | $32,300 | $122,500 |
| 2020 | $3,378 | $139,100 | $28,800 | $110,300 |
| 2019 | $3,096 | $139,100 | $28,800 | $110,300 |
| 2018 | $3,058 | $123,700 | $25,100 | $98,600 |
| 2017 | $2,742 | $123,700 | $25,100 | $98,600 |
| 2016 | $2,666 | $109,900 | $21,900 | $88,000 |
| 2015 | $2,666 | $109,900 | $21,900 | $88,000 |
| 2014 | $2,582 | $105,900 | $20,700 | $85,200 |
Source: Public Records
Map
Nearby Homes
Your Personal Tour Guide
Ask me questions while you tour the home.