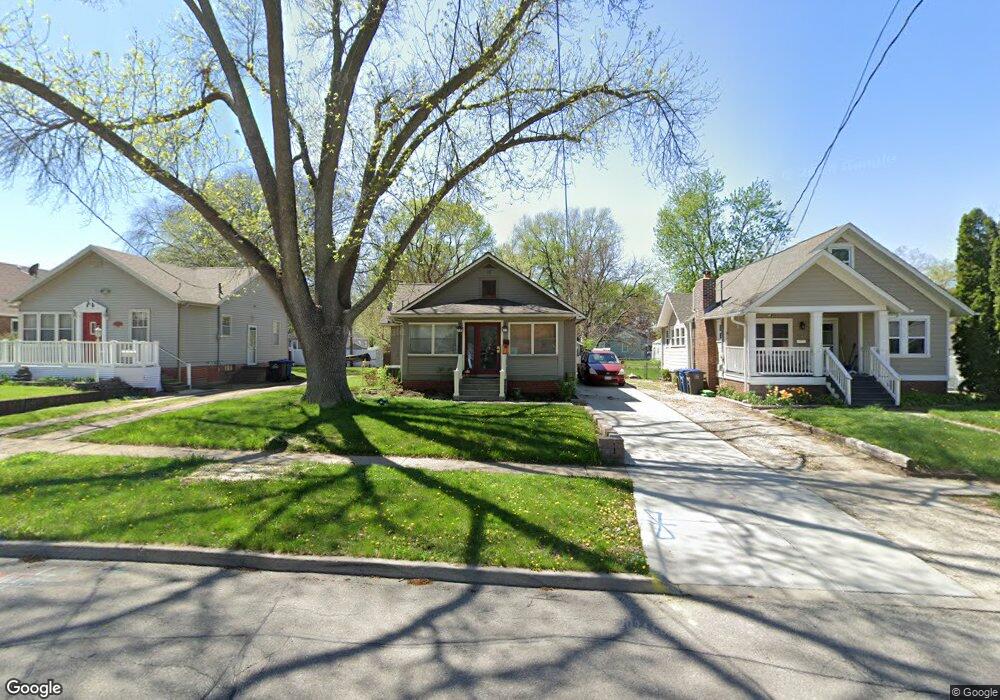
1434 56th St Des Moines, IA 50311
Merle Hay NeighborhoodEstimated Value: $216,460 - $226,000
3
Beds
1
Bath
1,176
Sq Ft
$188/Sq Ft
Est. Value
About This Home
This home is located at 1434 56th St, Des Moines, IA 50311 and is currently estimated at $221,615, approximately $188 per square foot. 1434 56th St is a home located in Polk County with nearby schools including Windsor Elementary School, Merrill Middle School, and Roosevelt High School.
Ownership History
Date
Name
Owned For
Owner Type
Purchase Details
Closed on
May 27, 2003
Sold by
Morgan Marian A and Bjorklund Lee Roy A
Bought by
Shonts John M and Shonts Elizabeth A
Current Estimated Value
Home Financials for this Owner
Home Financials are based on the most recent Mortgage that was taken out on this home.
Original Mortgage
$89,040
Outstanding Balance
$29,067
Interest Rate
2.37%
Mortgage Type
Purchase Money Mortgage
Estimated Equity
$192,548
Purchase Details
Closed on
Sep 22, 2001
Sold by
Arth Cynthia L and Arth Michael H
Bought by
Morgan Marian Arlene
Purchase Details
Closed on
Mar 27, 2000
Sold by
Morgan Marian A
Bought by
Arth Cynthia Louise and Hancock Rebecca Sue
Create a Home Valuation Report for This Property
The Home Valuation Report is an in-depth analysis detailing your home's value as well as a comparison with similar homes in the area
Home Values in the Area
Average Home Value in this Area
Purchase History
| Date | Buyer | Sale Price | Title Company |
|---|---|---|---|
| Shonts John M | $93,500 | -- | |
| Morgan Marian Arlene | -- | -- | |
| Arth Cynthia Louise | -- | -- |
Source: Public Records
Mortgage History
| Date | Status | Borrower | Loan Amount |
|---|---|---|---|
| Open | Shonts John M | $89,040 |
Source: Public Records
Tax History Compared to Growth
Tax History
| Year | Tax Paid | Tax Assessment Tax Assessment Total Assessment is a certain percentage of the fair market value that is determined by local assessors to be the total taxable value of land and additions on the property. | Land | Improvement |
|---|---|---|---|---|
| 2025 | $3,526 | $201,300 | $40,700 | $160,600 |
| 2024 | $3,526 | $179,200 | $35,800 | $143,400 |
| 2023 | $3,672 | $179,200 | $35,800 | $143,400 |
| 2022 | $3,644 | $155,800 | $32,300 | $123,500 |
| 2021 | $3,492 | $155,800 | $32,300 | $123,500 |
| 2020 | $3,626 | $139,900 | $28,800 | $111,100 |
| 2019 | $3,360 | $139,900 | $28,800 | $111,100 |
| 2018 | $3,326 | $125,000 | $25,100 | $99,900 |
| 2017 | $2,976 | $125,000 | $25,100 | $99,900 |
| 2016 | $2,898 | $110,000 | $21,900 | $88,100 |
| 2015 | $2,898 | $110,000 | $21,900 | $88,100 |
| 2014 | $2,904 | $109,300 | $21,300 | $88,000 |
Source: Public Records
Map
Nearby Homes