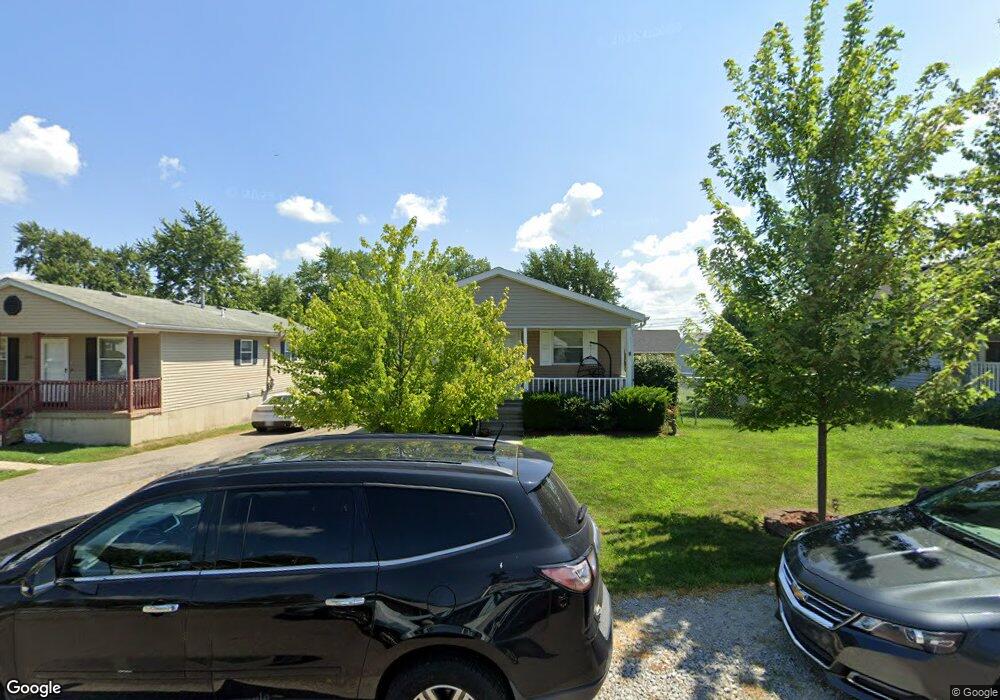
1434 Barney Ave Dayton, OH 45420
Estimated Value: $188,000 - $191,408
3
Beds
2
Baths
1,056
Sq Ft
$180/Sq Ft
Est. Value
About This Home
This home is located at 1434 Barney Ave, Dayton, OH 45420 and is currently estimated at $190,352, approximately $180 per square foot. 1434 Barney Ave is a home located in Montgomery County with nearby schools including Greenmont Elementary School, Kettering Middle School, and Kettering Fairmont High School.
Ownership History
Date
Name
Owned For
Owner Type
Purchase Details
Closed on
Jun 15, 2005
Sold by
Green Matthew L and Green Cassandra L
Bought by
Jeffries Jennifer A
Current Estimated Value
Home Financials for this Owner
Home Financials are based on the most recent Mortgage that was taken out on this home.
Original Mortgage
$110,625
Interest Rate
5.86%
Mortgage Type
FHA
Purchase Details
Closed on
Dec 22, 2000
Sold by
Wirk Farooq A
Bought by
Green Matthew L
Home Financials for this Owner
Home Financials are based on the most recent Mortgage that was taken out on this home.
Original Mortgage
$97,904
Interest Rate
7.8%
Mortgage Type
FHA
Purchase Details
Closed on
Jul 18, 1996
Sold by
Mirka John J and Mirka Michelle D
Bought by
Wirk Farooq A
Purchase Details
Closed on
Apr 22, 1994
Sold by
Gessner Dale R
Bought by
Mirka John J and Mirka Michelle D
Create a Home Valuation Report for This Property
The Home Valuation Report is an in-depth analysis detailing your home's value as well as a comparison with similar homes in the area
Home Values in the Area
Average Home Value in this Area
Purchase History
| Date | Buyer | Sale Price | Title Company |
|---|---|---|---|
| Jeffries Jennifer A | $111,500 | -- | |
| Green Matthew L | $98,000 | -- | |
| Wirk Farooq A | $86,500 | -- | |
| Mirka John J | -- | -- |
Source: Public Records
Mortgage History
| Date | Status | Borrower | Loan Amount |
|---|---|---|---|
| Previous Owner | Jeffries Jennifer A | $110,625 | |
| Previous Owner | Green Matthew L | $97,904 |
Source: Public Records
Tax History Compared to Growth
Tax History
| Year | Tax Paid | Tax Assessment Tax Assessment Total Assessment is a certain percentage of the fair market value that is determined by local assessors to be the total taxable value of land and additions on the property. | Land | Improvement |
|---|---|---|---|---|
| 2024 | $3,420 | $54,920 | $10,050 | $44,870 |
| 2023 | $3,420 | $54,920 | $10,050 | $44,870 |
| 2022 | $2,862 | $36,280 | $6,660 | $29,620 |
| 2021 | $2,648 | $36,280 | $6,660 | $29,620 |
| 2020 | $2,656 | $36,280 | $6,660 | $29,620 |
| 2019 | $2,479 | $29,910 | $6,660 | $23,250 |
| 2018 | $2,492 | $29,910 | $6,660 | $23,250 |
| 2017 | $2,297 | $29,910 | $6,660 | $23,250 |
| 2016 | $2,412 | $29,540 | $6,660 | $22,880 |
| 2015 | $2,305 | $29,540 | $6,660 | $22,880 |
| 2014 | $2,305 | $29,540 | $6,660 | $22,880 |
| 2012 | -- | $31,700 | $6,720 | $24,980 |
Source: Public Records
Map
Nearby Homes
- 1508 Horlacher Ave
- 1512 Horlacher Ave
- 4802 Amesborough Rd
- 1513 Horlacher Ave
- 4643 Amesborough Rd
- 1744 Woodman Dr
- 4549 Amesborough Rd
- 2830 Kennedy Ave
- 4527 Amesborough Rd
- 4869 Andes Dr
- 4515 Kingview Ave
- 2277 Lido Place
- 1108 Chelsea Ave
- 1300 Watervliet Ave
- 1630 Falke Dr
- 1910 Roop Place
- 1840 Culver Ave
- 1914 W Bataan Dr
- 4733 Barnhart Ave
- 1025 Weng Ave
- 1430 Barney Ave
- 1440 Barney Ave
- 1424 Barney Ave
- 1435 Flesher Ave
- 1431 Flesher Ave
- 1441 Flesher Ave
- 1420 Barney Ave
- 2008 Russell Ave
- 2000 Russell Ave
- 1425 Flesher Ave
- 1435 Barney Ave
- 1441 Barney Ave
- 1421 Flesher Ave
- 1501 Flesher Ave
- 1425 Barney Ave
- 1425 Barney Ave
- 1421 Barney Ave
- 1501 Barney Ave
- 1413 Flesher Ave
- 1505 Flesher Ave