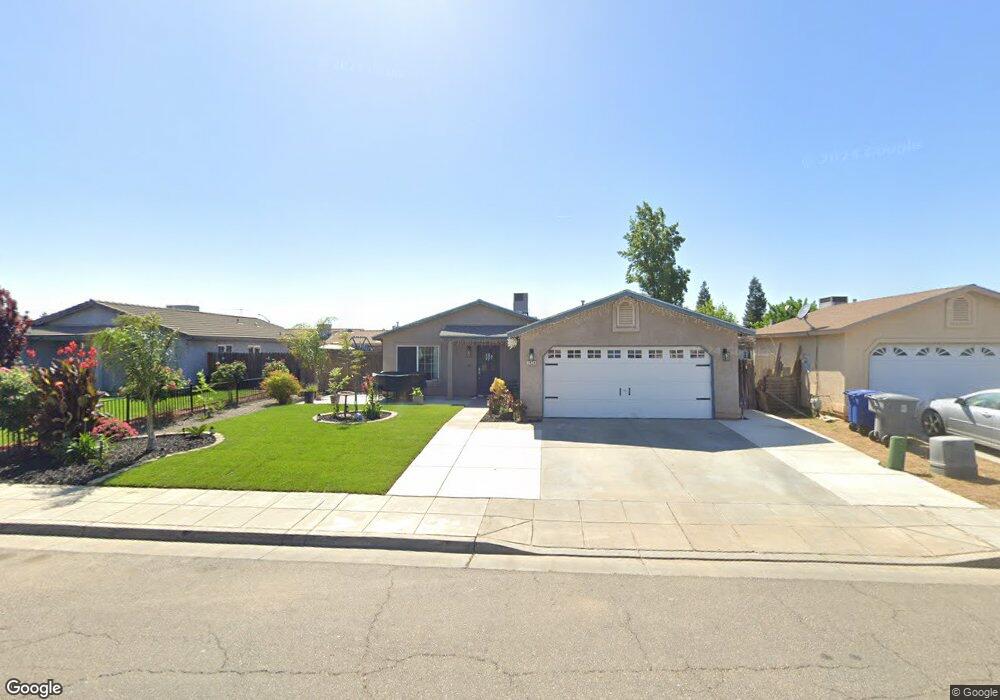
1434 Toluca Way Madera, CA 93638
North Madera NeighborhoodEstimated Value: $240,000 - $341,000
3
Beds
2
Baths
1,080
Sq Ft
$279/Sq Ft
Est. Value
About This Home
This home is located at 1434 Toluca Way, Madera, CA 93638 and is currently estimated at $301,228, approximately $278 per square foot. 1434 Toluca Way is a home located in Madera County with nearby schools including John J. Pershing Elementary School, Jack G. Desmond Middle School, and Madera South High School.
Ownership History
Date
Name
Owned For
Owner Type
Purchase Details
Closed on
Sep 21, 2023
Sold by
Aguirre Gildardo and Aguirre Bertha Alicia
Bought by
Gja Industries Inc
Current Estimated Value
Purchase Details
Closed on
Jun 29, 2022
Sold by
Rod And Sharon Edwards Family Trust
Bought by
Aguirre Gildardo and Aguirre Bertha Alisia
Home Financials for this Owner
Home Financials are based on the most recent Mortgage that was taken out on this home.
Original Mortgage
$168,000
Interest Rate
5.23%
Mortgage Type
New Conventional
Purchase Details
Closed on
Dec 19, 2008
Sold by
Edwards Rod S and Edwards Sharon K
Bought by
Edwards Rodney and Edwards Sharon
Purchase Details
Closed on
May 21, 2004
Sold by
H/S Development Co Llc
Bought by
Edwards Rod S and Edwards Sharon K
Home Financials for this Owner
Home Financials are based on the most recent Mortgage that was taken out on this home.
Original Mortgage
$116,619
Interest Rate
4.62%
Mortgage Type
Purchase Money Mortgage
Create a Home Valuation Report for This Property
The Home Valuation Report is an in-depth analysis detailing your home's value as well as a comparison with similar homes in the area
Home Values in the Area
Average Home Value in this Area
Purchase History
| Date | Buyer | Sale Price | Title Company |
|---|---|---|---|
| Gja Industries Inc | -- | None Listed On Document | |
| Aguirre Gildardo | $210,000 | Chicago Title | |
| Edwards Rodney | -- | None Available | |
| Edwards Rod S | $146,000 | Chicago Title |
Source: Public Records
Mortgage History
| Date | Status | Borrower | Loan Amount |
|---|---|---|---|
| Previous Owner | Aguirre Gildardo | $168,000 | |
| Previous Owner | Edwards Rod S | $116,619 |
Source: Public Records
Tax History Compared to Growth
Tax History
| Year | Tax Paid | Tax Assessment Tax Assessment Total Assessment is a certain percentage of the fair market value that is determined by local assessors to be the total taxable value of land and additions on the property. | Land | Improvement |
|---|---|---|---|---|
| 2025 | $3,174 | $270,504 | $67,626 | $202,878 |
| 2023 | $3,174 | $260,000 | $65,000 | $195,000 |
| 2022 | $2,243 | $191,420 | $59,100 | $132,320 |
| 2021 | $2,200 | $187,668 | $57,942 | $129,726 |
| 2020 | $1,840 | $152,049 | $46,946 | $105,103 |
| 2019 | $1,809 | $147,621 | $45,579 | $102,042 |
| 2018 | $1,552 | $134,200 | $41,435 | $92,765 |
| 2017 | $1,491 | $127,810 | $39,462 | $88,348 |
| 2016 | $1,453 | $125,304 | $38,688 | $86,616 |
| 2015 | $1,379 | $119,337 | $36,846 | $82,491 |
| 2014 | $1,207 | $109,484 | $33,804 | $75,680 |
Source: Public Records
Map
Nearby Homes
- 1331 Alicante Way
- 27592 Avenue 16
- 27594 Avenue 16
- 1592 Lacreta Ave
- 1419 E Yosemite Ave
- 1218 E Cleveland Ave Unit 131
- 1218 E Cleveland Ave Unit 4
- 1218 E Cleveland Ave Unit 126
- 1218 E Cleveland Ave Unit 142
- 1218 E Cleveland Ave Unit 114
- 1218 E Cleveland Ave Unit 12
- 1218 E Cleveland Ave Unit 96
- 1218 E Cleveland Ave Unit 123
- 1218 E Cleveland Ave Unit 161
- 1218 E Cleveland Ave Unit 19
- 1218 E Cleveland Ave Unit 86
- 1218 E Cleveland Ave Unit 23
- 1218 E Cleveland Ave Unit 103
- 1218 E Cleveland Ave Unit 153
- 1218 E Cleveland Ave Unit 1
- 1422 Toluca Way
- 1433 Alicante Way
- 1457 Alicante Way
- 1425 Alicante Way
- 1402 Toluca Way
- 1466 Toluca Way
- 1435 Toluca Way
- 1469 Alicante Way
- 1401 Alicante Way
- 1423 Toluca Way
- 1455 Toluca Way
- 1394 Toluca Way
- 1486 Toluca Way
- 1403 Toluca Way
- 1467 Toluca Way
- 1489 Alicante Way
- 1395 Alicante Way
- 1397 Toluca Way
- 1487 Toluca Way
- 1370 Toluca Way