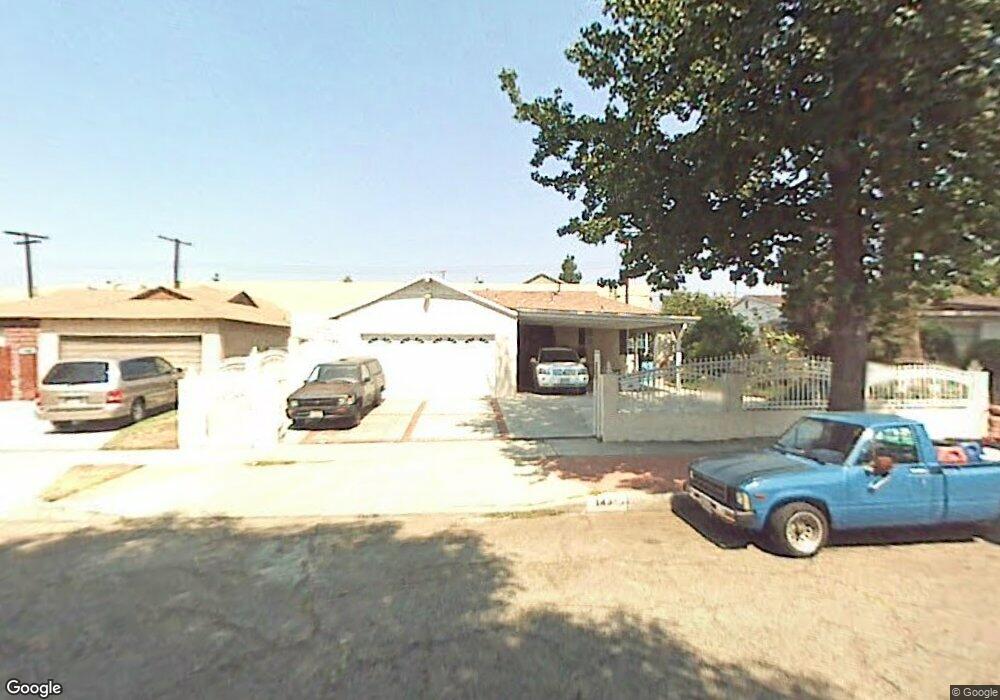
14349 Carl St Arleta, CA 91331
Estimated Value: $801,000 - $839,941
4
Beds
2
Baths
1,642
Sq Ft
$502/Sq Ft
Est. Value
About This Home
This home is located at 14349 Carl St, Arleta, CA 91331 and is currently estimated at $824,235, approximately $501 per square foot. 14349 Carl St is a home located in Los Angeles County with nearby schools including Liggett Street Elementary, Pacoima Middle School, and Arleta High.
Ownership History
Date
Name
Owned For
Owner Type
Purchase Details
Closed on
May 20, 2022
Sold by
Dela Fuente Laura and Jimenez Jorge E
Bought by
Jimenez Jorge and Jimenez Laura
Current Estimated Value
Home Financials for this Owner
Home Financials are based on the most recent Mortgage that was taken out on this home.
Original Mortgage
$200,000
Outstanding Balance
$189,756
Interest Rate
5.11%
Mortgage Type
New Conventional
Estimated Equity
$634,479
Purchase Details
Closed on
Jun 22, 2005
Sold by
Jimenez Jorge E and De La Fuente Laura
Bought by
Jimenez Jorge E
Home Financials for this Owner
Home Financials are based on the most recent Mortgage that was taken out on this home.
Original Mortgage
$211,000
Interest Rate
5.56%
Mortgage Type
Fannie Mae Freddie Mac
Purchase Details
Closed on
Sep 26, 2003
Sold by
Alfaro Armando
Bought by
Jimenez Jorge E
Purchase Details
Closed on
Feb 5, 1994
Sold by
Perez Luis Alberto Calva
Bought by
Torres Jorge E Jimenez
Create a Home Valuation Report for This Property
The Home Valuation Report is an in-depth analysis detailing your home's value as well as a comparison with similar homes in the area
Home Values in the Area
Average Home Value in this Area
Purchase History
| Date | Buyer | Sale Price | Title Company |
|---|---|---|---|
| Jimenez Jorge | -- | New Title Company Name | |
| Jimenez Jorge E | -- | -- | |
| Jimenez Jorge E | $2,500 | -- | |
| Torres Jorge E Jimenez | -- | -- |
Source: Public Records
Mortgage History
| Date | Status | Borrower | Loan Amount |
|---|---|---|---|
| Open | Jimenez Jorge | $200,000 | |
| Previous Owner | Jimenez Jorge E | $211,000 |
Source: Public Records
Tax History Compared to Growth
Tax History
| Year | Tax Paid | Tax Assessment Tax Assessment Total Assessment is a certain percentage of the fair market value that is determined by local assessors to be the total taxable value of land and additions on the property. | Land | Improvement |
|---|---|---|---|---|
| 2025 | $4,609 | $357,249 | $191,527 | $165,722 |
| 2024 | $4,609 | $350,245 | $187,772 | $162,473 |
| 2023 | $4,522 | $343,379 | $184,091 | $159,288 |
| 2022 | $4,315 | $336,647 | $180,482 | $156,165 |
| 2021 | $4,254 | $330,047 | $176,944 | $153,103 |
| 2020 | $4,291 | $326,664 | $175,130 | $151,534 |
| 2019 | $4,047 | $320,260 | $171,697 | $148,563 |
| 2018 | $3,932 | $313,981 | $168,331 | $145,650 |
| 2016 | $3,745 | $301,792 | $161,796 | $139,996 |
| 2015 | $3,691 | $297,260 | $159,366 | $137,894 |
| 2014 | $3,711 | $291,438 | $156,245 | $135,193 |
Source: Public Records
Map
Nearby Homes
- 14500 Van Nuys Blvd Unit 33
- 14448 Pinney St
- 14430 Pinney St
- 9800 Vesper Ave Unit 28
- 9600 Van Nuys Blvd Unit 102
- 9600 Van Nuys Blvd Unit 206
- 9600 Van Nuys Blvd Unit 220
- 9758 N Abrego Ct
- 9525 Sylmar Ave Unit 2
- 14520 Plummer St Unit 21
- 14148 Gain St
- 14106 Gruen St
- 14143 Terra Bella St
- 14157 Terra Bella St
- 9548 Cedros Ave
- 14265 Terra Bella St Unit 10
- 9346 Van Nuys Blvd Unit 4
- 9870 Woodale Ave
- 14080 Garber St
- 9315 Woodman Ave Unit 8