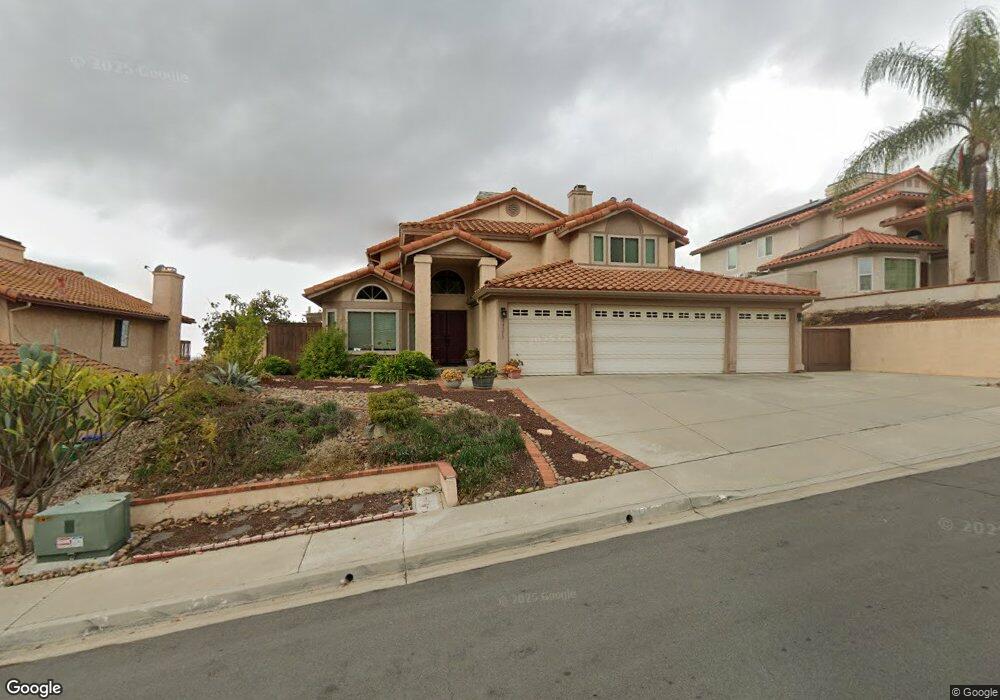
14352 Bourgeois Way San Diego, CA 92129
Rancho Peñasquitos NeighborhoodEstimated Value: $1,570,000 - $1,738,000
4
Beds
3
Baths
2,888
Sq Ft
$577/Sq Ft
Est. Value
About This Home
This home is located at 14352 Bourgeois Way, San Diego, CA 92129 and is currently estimated at $1,666,263, approximately $576 per square foot. 14352 Bourgeois Way is a home located in San Diego County with nearby schools including Sunset Hills Elementary School, Black Mountain Middle School, and Mt. Carmel High School.
Ownership History
Date
Name
Owned For
Owner Type
Purchase Details
Closed on
Feb 11, 2004
Sold by
Smith Thomas G and Koppel Caroline
Bought by
Smith Thomas G and Koppel Caroline D
Current Estimated Value
Purchase Details
Closed on
Dec 1, 1997
Sold by
Quiring James J and Quiring Karol E
Bought by
Smith Thomas G and Koppel Caroline
Home Financials for this Owner
Home Financials are based on the most recent Mortgage that was taken out on this home.
Original Mortgage
$261,600
Outstanding Balance
$43,984
Interest Rate
7.16%
Estimated Equity
$1,622,279
Purchase Details
Closed on
Aug 4, 1995
Sold by
Sirkin Victor I and Sirkin Kathleen A
Bought by
Quiring James J and Quiring Karol E
Home Financials for this Owner
Home Financials are based on the most recent Mortgage that was taken out on this home.
Original Mortgage
$192,000
Interest Rate
7.71%
Purchase Details
Closed on
Sep 25, 1987
Create a Home Valuation Report for This Property
The Home Valuation Report is an in-depth analysis detailing your home's value as well as a comparison with similar homes in the area
Home Values in the Area
Average Home Value in this Area
Purchase History
| Date | Buyer | Sale Price | Title Company |
|---|---|---|---|
| Smith Thomas G | -- | -- | |
| Smith Thomas G | $327,000 | Commonwealth Land Title Co | |
| Quiring James J | $240,000 | Continental Lawyers Title Co | |
| -- | $209,000 | -- |
Source: Public Records
Mortgage History
| Date | Status | Borrower | Loan Amount |
|---|---|---|---|
| Open | Smith Thomas G | $261,600 | |
| Previous Owner | Quiring James J | $192,000 |
Source: Public Records
Tax History Compared to Growth
Tax History
| Year | Tax Paid | Tax Assessment Tax Assessment Total Assessment is a certain percentage of the fair market value that is determined by local assessors to be the total taxable value of land and additions on the property. | Land | Improvement |
|---|---|---|---|---|
| 2025 | $6,286 | $571,405 | $144,750 | $426,655 |
| 2024 | $6,286 | $560,202 | $141,912 | $418,290 |
| 2023 | $6,150 | $549,219 | $139,130 | $410,089 |
| 2022 | $6,045 | $538,451 | $136,402 | $402,049 |
| 2021 | $5,964 | $527,894 | $133,728 | $394,166 |
| 2020 | $5,883 | $522,482 | $132,357 | $390,125 |
| 2019 | $5,728 | $512,238 | $129,762 | $382,476 |
| 2018 | $5,566 | $502,195 | $127,218 | $374,977 |
| 2017 | $83 | $492,349 | $124,724 | $367,625 |
| 2016 | $5,302 | $482,696 | $122,279 | $360,417 |
| 2015 | $5,223 | $475,447 | $120,443 | $355,004 |
| 2014 | $5,098 | $466,134 | $118,084 | $348,050 |
Source: Public Records
Map
Nearby Homes
- 14442 Calle Nublado
- 9360 Stargaze Ave
- 9120 Meadowrun Place
- 9151 Emden Rd
- 13907 Bruyere Ct
- 8862 La Cartera St
- 14305 El Vestido St
- 8183 Doug Hill
- 8730 Twin Trails Dr
- 8114 Sendero de La Pradera
- 13879 Paseo Cardiel
- 13856 Paseo Cardiel
- 9959 Riverhead Dr
- 13837 Paseo Cardiel
- 13559 Chaco Ct
- 9858 Via Caceres
- 13445 Appalachian Way
- 9555 Via Pereza
- 13640 Via Cima Bella
- 7795 Sendero Angelica
- 14362 Bourgeois Way
- 14344 Bourgeois Way
- 14357 Dalhousie Rd
- 14370 Bourgeois Way
- 14334 Bourgeois Way
- 14349 Dalhousie Rd
- 14365 Dalhousie Rd
- 14341 Dalhousie Rd
- 14375 Bourgeois Way
- 14367 Bourgeois Way
- 14373 Dalhousie Rd
- 14333 Dalhousie Rd
- 14381 Bourgeois Way
- 14380 Bourgeois Way
- 14361 Bourgeois Way Unit 2
- 14326 Bourgeois Way
- 14381 Dalhousie Rd
- 14353 Bourgeois Way
- 14389 Bourgeois Way
- 14325 Dalhousie Rd