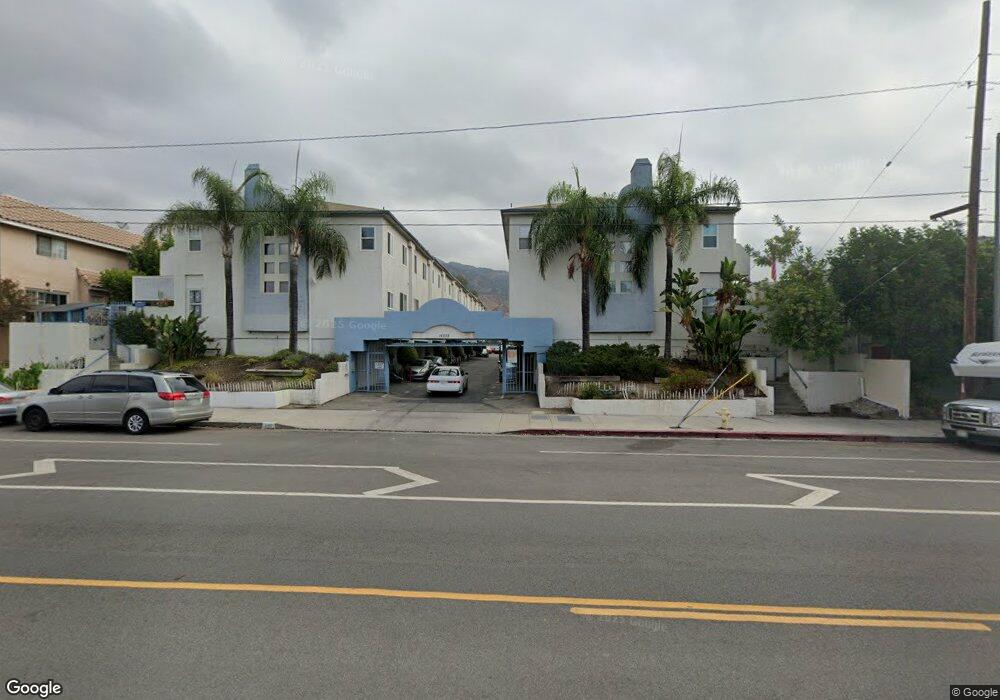
14355 Foothill Blvd Unit 15 Sylmar, CA 91342
Estimated Value: $540,000 - $562,000
3
Beds
3
Baths
1,314
Sq Ft
$418/Sq Ft
Est. Value
About This Home
This home is located at 14355 Foothill Blvd Unit 15, Sylmar, CA 91342 and is currently estimated at $548,673, approximately $417 per square foot. 14355 Foothill Blvd Unit 15 is a home located in Los Angeles County with nearby schools including Sylmar Leadership Academy, San Fernando Senior High School, and PUC Community Charter Elementary School.
Ownership History
Date
Name
Owned For
Owner Type
Purchase Details
Closed on
Jun 27, 2003
Sold by
Burke Paul F and Burke Joan C
Bought by
Burke Paul
Current Estimated Value
Purchase Details
Closed on
Jul 2, 2001
Sold by
Carpintero Damian
Bought by
Burke Paul F
Home Financials for this Owner
Home Financials are based on the most recent Mortgage that was taken out on this home.
Original Mortgage
$145,500
Outstanding Balance
$56,113
Interest Rate
7.15%
Mortgage Type
FHA
Estimated Equity
$492,560
Purchase Details
Closed on
Oct 29, 1993
Sold by
Oliveview Villas L P
Bought by
Carpintero Damian
Home Financials for this Owner
Home Financials are based on the most recent Mortgage that was taken out on this home.
Original Mortgage
$121,850
Interest Rate
6%
Mortgage Type
FHA
Create a Home Valuation Report for This Property
The Home Valuation Report is an in-depth analysis detailing your home's value as well as a comparison with similar homes in the area
Home Values in the Area
Average Home Value in this Area
Purchase History
| Date | Buyer | Sale Price | Title Company |
|---|---|---|---|
| Burke Paul | -- | North American Title Co | |
| Burke Paul F | $150,000 | Fidelity Title | |
| Carpintero Damian | $126,000 | -- |
Source: Public Records
Mortgage History
| Date | Status | Borrower | Loan Amount |
|---|---|---|---|
| Open | Burke Paul F | $145,500 | |
| Previous Owner | Carpintero Damian | $121,850 |
Source: Public Records
Tax History Compared to Growth
Tax History
| Year | Tax Paid | Tax Assessment Tax Assessment Total Assessment is a certain percentage of the fair market value that is determined by local assessors to be the total taxable value of land and additions on the property. | Land | Improvement |
|---|---|---|---|---|
| 2025 | $2,700 | $221,569 | $49,773 | $171,796 |
| 2024 | $2,700 | $217,226 | $48,798 | $168,428 |
| 2023 | $2,648 | $212,968 | $47,842 | $165,126 |
| 2022 | $2,524 | $208,793 | $46,904 | $161,889 |
| 2021 | $2,486 | $204,700 | $45,985 | $158,715 |
| 2019 | $2,410 | $198,630 | $44,622 | $154,008 |
| 2018 | $2,385 | $194,737 | $43,748 | $150,989 |
| 2016 | $2,264 | $187,177 | $42,050 | $145,127 |
| 2015 | $2,231 | $184,367 | $41,419 | $142,948 |
| 2014 | $2,243 | $180,756 | $40,608 | $140,148 |
Source: Public Records
Map
Nearby Homes
- 14365 Foothill Blvd Unit 7
- 14325 Foothill Blvd Unit 34
- 14344 Foothill Blvd Unit 306
- 14380 Foothill Blvd Unit 24
- 14293 Foothill Blvd Unit 19
- 14293 Foothill Blvd Unit 21
- 14291 Foothill Blvd Unit 11
- 14425 Foothill Blvd Unit 17
- 14287 Foothill Blvd Unit 41
- 14287 Foothill Blvd Unit 33
- 13901 Olive View Ln Unit 57
- 13901 Olive View Ln Unit 51
- 14456 Foothill Blvd Unit 43
- 14456 Foothill Blvd Unit 28
- 14233 Foothill Blvd Unit 9
- 13748 Amanda Ln
- 13717 Deane Ln
- 14201 Foothill Blvd Unit 49
- 14519 Ryan St
- 14523 Ryan St
- 14355 Foothill Blvd
- 14355 Foothill Blvd
- 14355 Foothill Blvd Unit 9
- 14355 Foothill Blvd Unit 8
- 14355 Foothill Blvd Unit 7
- 14355 Foothill Blvd Unit 6
- 14355 Foothill Blvd Unit 5
- 14355 Foothill Blvd Unit 4
- 14355 Foothill Blvd Unit 3
- 14355 Foothill Blvd Unit 2
- 14355 Foothill Blvd Unit 1
- 14355 Foothill Blvd Unit 22
- 14355 Foothill Blvd Unit 21
- 14355 Foothill Blvd Unit 20
- 14355 Foothill Blvd Unit 19
- 14355 Foothill Blvd Unit 18
- 14355 Foothill Blvd Unit 17
- 14355 Foothill Blvd Unit 16
- 14355 Foothill Blvd Unit 14
- 14355 Foothill Blvd Unit 13