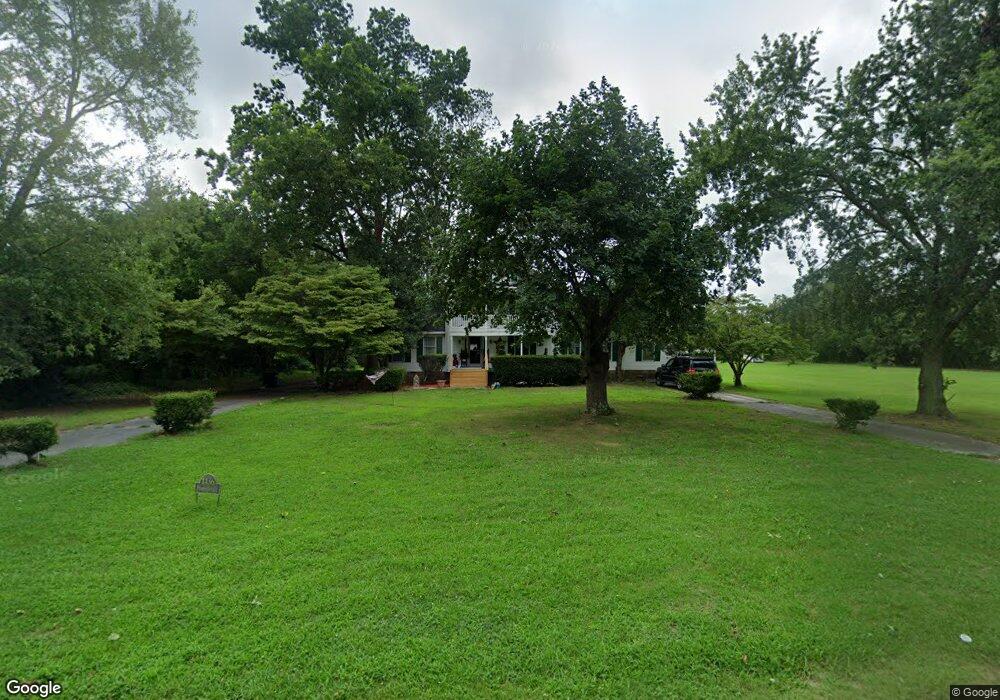
1436 Pemberton Dr Salisbury, MD 21801
South Salisbury NeighborhoodEstimated Value: $206,000 - $425,775
4
Beds
3
Baths
2,470
Sq Ft
$127/Sq Ft
Est. Value
About This Home
This home is located at 1436 Pemberton Dr, Salisbury, MD 21801 and is currently estimated at $314,194, approximately $127 per square foot. 1436 Pemberton Dr is a home located in Wicomico County with nearby schools including Pemberton Elementary School, Salisbury Middle School, and James M. Bennett High School.
Ownership History
Date
Name
Owned For
Owner Type
Purchase Details
Closed on
Apr 22, 2025
Sold by
Learned Orville H and Evans Bonnie M
Bought by
Thornton Properties Llc
Current Estimated Value
Home Financials for this Owner
Home Financials are based on the most recent Mortgage that was taken out on this home.
Original Mortgage
$300,000
Outstanding Balance
$240,738
Interest Rate
6.65%
Mortgage Type
Credit Line Revolving
Estimated Equity
$73,456
Purchase Details
Closed on
Jun 3, 2005
Sold by
Ashcraft R and Ashcraft L Y
Bought by
Learned Orville H and Evans Bonnie M
Purchase Details
Closed on
May 25, 2005
Sold by
Ashcraft R and Ashcraft L Y
Bought by
Learned Orville H and Evans Bonnie M
Purchase Details
Closed on
Sep 21, 2001
Sold by
Elliott Development Partnership
Bought by
Ashcraft Randy L and Ashcraft Melissa
Purchase Details
Closed on
Jan 16, 2001
Sold by
Bailey Robert F and Bailey Janice D
Bought by
Elliott Development Partnership
Create a Home Valuation Report for This Property
The Home Valuation Report is an in-depth analysis detailing your home's value as well as a comparison with similar homes in the area
Home Values in the Area
Average Home Value in this Area
Purchase History
| Date | Buyer | Sale Price | Title Company |
|---|---|---|---|
| Thornton Properties Llc | $200,000 | None Listed On Document | |
| Thornton Properties Llc | $200,000 | None Listed On Document | |
| Learned Orville H | $379,900 | -- | |
| Learned Orville H | $379,900 | -- | |
| Ashcraft Randy L | $238,000 | -- | |
| Elliott Development Partnership | $550,000 | -- |
Source: Public Records
Mortgage History
| Date | Status | Borrower | Loan Amount |
|---|---|---|---|
| Open | Thornton Properties Llc | $300,000 | |
| Closed | Thornton Properties Llc | $300,000 | |
| Closed | Ashcraft Randy L | -- |
Source: Public Records
Tax History
| Year | Tax Paid | Tax Assessment Tax Assessment Total Assessment is a certain percentage of the fair market value that is determined by local assessors to be the total taxable value of land and additions on the property. | Land | Improvement |
|---|---|---|---|---|
| 2025 | $2,771 | $296,667 | $0 | $0 |
| 2024 | $2,636 | $283,200 | $37,100 | $246,100 |
| 2023 | $2,547 | $265,600 | $0 | $0 |
| 2022 | $2,532 | $248,000 | $0 | $0 |
| 2021 | $2,351 | $230,400 | $37,100 | $193,300 |
| 2020 | $2,351 | $222,133 | $0 | $0 |
| 2019 | $2,298 | $213,867 | $0 | $0 |
| 2018 | $4,002 | $205,600 | $37,100 | $168,500 |
| 2017 | $3,909 | $196,733 | $0 | $0 |
| 2016 | -- | $187,867 | $0 | $0 |
| 2015 | $3,859 | $179,000 | $0 | $0 |
| 2014 | $3,859 | $179,000 | $0 | $0 |
Source: Public Records
Map
Nearby Homes
- 5951 Fire Fly Dr
- 811 Upland Dr
- 1411 Chateau Dr
- 5998 Fire Fly Dr
- 1122 Albritton Ln
- CALI Plan at Birdsong Village
- LISMORE Plan at Birdsong Village
- BOARDWALK Plan at Birdsong Village
- SULLIVAN Plan at Birdsong Village
- FREEPORT Plan at Birdsong Village
- 1118 Albritton Ln
- 5952 Tappan Ln
- 6023 Tarry Town Rd
- 28122 Van Tassel Way
- 1111 Albritton Ln
- 1123 Albritton Ln
- 1113 Albritton Ln
- 28111 Van Tassel Way
- 1129 Albritton Ln
- 5926 Tappan Ln
- 1439 Pemberton Dr
- 1400 E Upland Dr
- 1401 E Upland Dr
- 1402 E Upland Dr
- 1404 E Upland Dr
- 800 Meadow Point Rd
- 1405 E Upland Dr
- 1431 Pemberton Dr
- 1449 Pemberton Dr
- 801 Meadow Point Rd
- 802 Meadow Point Rd
- 6041 Fairfax Cir
- 1407 E Upland Dr
- 1408 E Upland Dr
- 1426 Pemberton Dr
- 803 Meadow Point Rd
- 6045 Fairfax Cir
- 804 Meadow Point Rd
- 1409 E Upland Dr
- 805 Meadow Point Rd
Your Personal Tour Guide
Ask me questions while you tour the home.