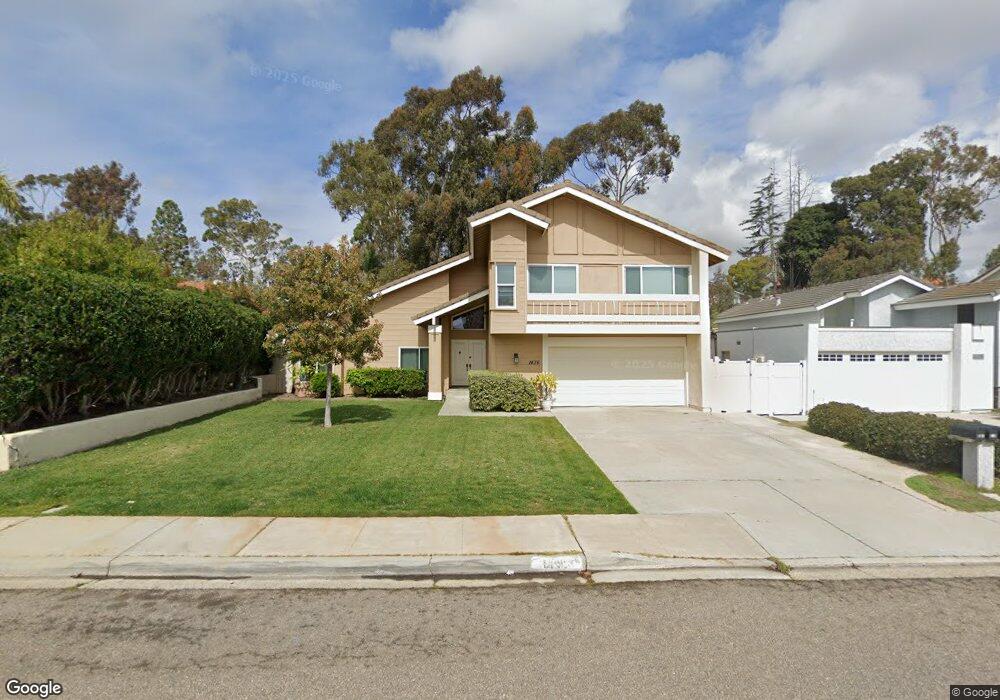
1436 Tzena Way Encinitas, CA 92024
Central Encinitas NeighborhoodEstimated Value: $1,720,544 - $1,944,000
4
Beds
3
Baths
2,358
Sq Ft
$769/Sq Ft
Est. Value
About This Home
This home is located at 1436 Tzena Way, Encinitas, CA 92024 and is currently estimated at $1,812,886, approximately $768 per square foot. 1436 Tzena Way is a home located in San Diego County with nearby schools including Flora Vista Elementary, Diegueno Middle School, and La Costa Canyon High School.
Ownership History
Date
Name
Owned For
Owner Type
Purchase Details
Closed on
Apr 29, 2021
Sold by
Alpern Sharon L and The Sandra Alpern Trust
Bought by
Alpern Sharon L and Alpern Rachel M
Current Estimated Value
Purchase Details
Closed on
Sep 5, 2007
Sold by
Sandra Alpern Trust and Alpern Sharon L
Bought by
Alpern Sharon L and Alpern Rachel M
Purchase Details
Closed on
May 23, 2006
Sold by
Alpern Frederick D
Bought by
Alpern Sandra R
Home Financials for this Owner
Home Financials are based on the most recent Mortgage that was taken out on this home.
Original Mortgage
$450,000
Interest Rate
6.22%
Mortgage Type
Negative Amortization
Purchase Details
Closed on
Nov 2, 1987
Create a Home Valuation Report for This Property
The Home Valuation Report is an in-depth analysis detailing your home's value as well as a comparison with similar homes in the area
Home Values in the Area
Average Home Value in this Area
Purchase History
| Date | Buyer | Sale Price | Title Company |
|---|---|---|---|
| Alpern Sharon L | -- | None Available | |
| Alpern Sharon L | -- | None Listed On Document | |
| Alpern Sandra | -- | None Available | |
| Alpern Sandra R | -- | Chicago Title Co | |
| -- | $205,000 | -- |
Source: Public Records
Mortgage History
| Date | Status | Borrower | Loan Amount |
|---|---|---|---|
| Previous Owner | Alpern Sandra R | $450,000 |
Source: Public Records
Tax History
| Year | Tax Paid | Tax Assessment Tax Assessment Total Assessment is a certain percentage of the fair market value that is determined by local assessors to be the total taxable value of land and additions on the property. | Land | Improvement |
|---|---|---|---|---|
| 2025 | $4,636 | $392,346 | $149,457 | $242,889 |
| 2024 | $4,636 | $384,654 | $146,527 | $238,127 |
| 2023 | $4,481 | $377,112 | $143,654 | $233,458 |
| 2022 | $4,358 | $369,719 | $140,838 | $228,881 |
| 2021 | $5,448 | $362,471 | $138,077 | $224,394 |
| 2020 | $5,346 | $358,756 | $136,662 | $222,094 |
| 2019 | $5,265 | $351,723 | $133,983 | $217,740 |
| 2018 | $5,197 | $344,827 | $131,356 | $213,471 |
| 2017 | $3,976 | $338,067 | $128,781 | $209,286 |
| 2016 | $3,859 | $331,439 | $126,256 | $205,183 |
| 2015 | $3,778 | $326,461 | $124,360 | $202,101 |
| 2014 | $3,680 | $320,067 | $121,924 | $198,143 |
Source: Public Records
Map
Nearby Homes
- 1693 Honeysuckle Ct
- 1642 Blossom Field Way
- 1617 Blossom Field Way
- 350 N El Camino Real Unit 78s
- 350 N El Camino Real Unit 72
- 1517 Shields Ave
- 1709 Edgefield Ln
- 1733 Gentle Breeze Ln
- 1105 Catania Ct Unit 201
- 804 & 814 Clark Ave
- 3736 38 Via Rancho Michelle
- 200 202 Neptune Ave
- 772 Conestoga Ct
- 250 258 Hillcrest Dr
- 444 N El Camino Real Unit 47
- 444 N El Camino Real Unit 48
- 444 N El Camino Real Unit SPC 42
- 444 N El Camino Real Unit 119
- 444 N El Camino Real Unit 23
- 444 N El Camino Real Unit 110
Your Personal Tour Guide
Ask me questions while you tour the home.