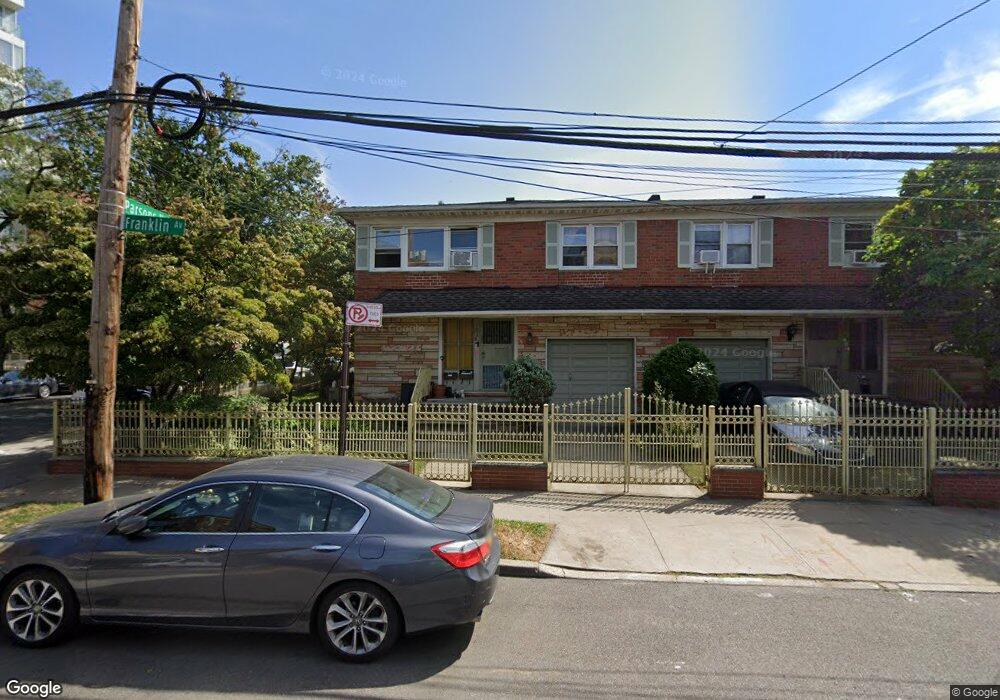
14368 Franklin Ave Flushing, NY 11355
Flushing NeighborhoodEstimated Value: $1,140,000 - $1,961,000
2
Beds
2
Baths
1,000
Sq Ft
$1,664/Sq Ft
Est. Value
About This Home
This home is located at 14368 Franklin Ave, Flushing, NY 11355 and is currently estimated at $1,664,000, approximately $1,664 per square foot. 14368 Franklin Ave is a home located in Queens County with nearby schools including P.S. 20 John Bowne Elementary, Rachel Carson I.S. 237Q, and John Bowne High School.
Ownership History
Date
Name
Owned For
Owner Type
Purchase Details
Closed on
Mar 28, 2017
Sold by
Hwang Elaine Wen-Yu and Hwang Evonne W
Bought by
143-68 Franklin Ave Llc
Current Estimated Value
Home Financials for this Owner
Home Financials are based on the most recent Mortgage that was taken out on this home.
Original Mortgage
$176,647
Outstanding Balance
$146,795
Interest Rate
4.16%
Mortgage Type
Purchase Money Mortgage
Estimated Equity
$1,517,205
Purchase Details
Closed on
Feb 18, 2011
Sold by
Hwang Jung-Te
Bought by
Hwang Elaine Wen-Yu and Hwang Evonne W
Purchase Details
Closed on
Feb 24, 1999
Sold by
Hwang & Associates Ny Inc
Bought by
Hwang Jung Te
Purchase Details
Closed on
Jan 29, 1998
Sold by
Santos Raymundo J and Santos Purification V
Bought by
Hwang & Associates Ny Inc
Home Financials for this Owner
Home Financials are based on the most recent Mortgage that was taken out on this home.
Original Mortgage
$234,500
Interest Rate
6.85%
Create a Home Valuation Report for This Property
The Home Valuation Report is an in-depth analysis detailing your home's value as well as a comparison with similar homes in the area
Home Values in the Area
Average Home Value in this Area
Purchase History
| Date | Buyer | Sale Price | Title Company |
|---|---|---|---|
| 143-68 Franklin Ave Llc | -- | -- | |
| Hwang Elaine Wen-Yu | $380,000 | -- | |
| Hwang Jung Te | $100,000 | First American Title Ins Co | |
| Hwang & Associates Ny Inc | $355,000 | -- |
Source: Public Records
Mortgage History
| Date | Status | Borrower | Loan Amount |
|---|---|---|---|
| Open | 143-68 Franklin Ave Llc | $176,647 | |
| Previous Owner | Hwang & Associates Ny Inc | $234,500 |
Source: Public Records
Tax History Compared to Growth
Tax History
| Year | Tax Paid | Tax Assessment Tax Assessment Total Assessment is a certain percentage of the fair market value that is determined by local assessors to be the total taxable value of land and additions on the property. | Land | Improvement |
|---|---|---|---|---|
| 2025 | $14,194 | $74,904 | $10,811 | $64,093 |
| 2024 | $14,194 | $70,668 | $10,844 | $59,824 |
| 2023 | $13,461 | $67,018 | $8,820 | $58,198 |
| 2022 | $9,736 | $100,080 | $12,540 | $87,540 |
| 2021 | $13,685 | $85,740 | $12,540 | $73,200 |
| 2020 | $13,212 | $80,940 | $12,540 | $68,400 |
| 2019 | $12,319 | $74,580 | $12,540 | $62,040 |
| 2018 | $11,385 | $55,848 | $9,345 | $46,503 |
| 2017 | $11,046 | $54,189 | $10,286 | $43,903 |
| 2016 | $10,833 | $54,189 | $10,286 | $43,903 |
| 2014 | $5,946 | $49,075 | $13,042 | $36,033 |
Source: Public Records
Map
Nearby Homes
- 14340 Franklin Ave
- 4223 Parsons Blvd Unit 1E
- 42-11 Parsons Blvd Unit 4B
- 42-11 Parsons Blvd Unit Parking
- 42-11 Parsons Blvd Unit 4D
- 42-11 Parsons Blvd Unit 2D
- 143-37 Beech Ave
- 144-30 Sanford Ave Unit 2C
- 144-30 Sanford Ave Unit 6V
- 144-30 Sanford Ave Unit 5
- 144-30 Sanford Ave Unit 4N
- 144-11 Sanford Ave Unit 4K
- 144-44 Sanford Ave Unit 3
- 144-27 Sanford Ave Unit 8
- 144-27 Sanford Ave Unit 2
- 144-27 Sanford Ave Unit 4
- 143-22 Beech Ave
- 4133 Parsons Blvd Unit 3C
- 144-54 Sanford Ave Unit 38
- 144-54 Sanford Ave Unit 55
- 14368 Franklin Ave Unit 1 Fl
- 14368 Franklin Ave Unit 2nd FL
- 14368 Franklin Ave
- 14366 Franklin Ave Unit 2nd Fl
- 14366 Franklin Ave Unit 2Fl
- 14366 Franklin Ave
- 14366 Franklin Ave Unit 2F
- 14366 Franklin Ave
- 4212 Parsons Blvd
- 14360 Franklin Ave
- 4214 Parsons Blvd
- 14358 Franklin Ave
- 42-05 Parsons Blvd Unit 2A
- 42-05 Parsons Blvd Unit 4A
- 42-05 Parsons Blvd Unit C1-5
- 14356 Franklin Ave
- 4180 Parsons Blvd
- 14356 Franklin Ave
- 14354 Franklin Ave
- 14354 Franklin Ave Unit 2nd Fl