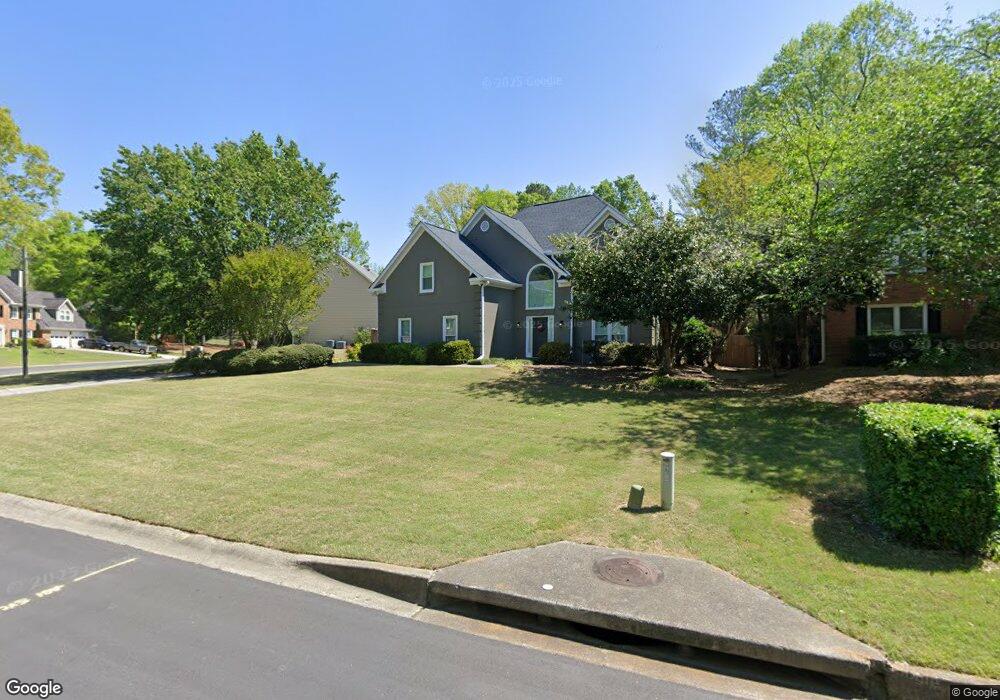
1437 Fenwick Dr SW Unit 91 Marietta, GA 30064
West Cobb NeighborhoodEstimated Value: $474,248 - $553,000
4
Beds
3
Baths
2,924
Sq Ft
$176/Sq Ft
Est. Value
About This Home
This home is located at 1437 Fenwick Dr SW Unit 91, Marietta, GA 30064 and is currently estimated at $513,562, approximately $175 per square foot. 1437 Fenwick Dr SW Unit 91 is a home located in Cobb County with nearby schools including Cheatham Hill Elementary School, Lovinggood Middle School, and Hillgrove High School.
Ownership History
Date
Name
Owned For
Owner Type
Purchase Details
Closed on
Sep 22, 2017
Sold by
Hughey Judy K
Bought by
Wachuku Chigozirim and Wachuku Blessing
Current Estimated Value
Home Financials for this Owner
Home Financials are based on the most recent Mortgage that was taken out on this home.
Original Mortgage
$268,850
Outstanding Balance
$144,794
Interest Rate
3.86%
Mortgage Type
New Conventional
Estimated Equity
$368,768
Purchase Details
Closed on
May 9, 2017
Sold by
Hughey Julius T
Bought by
Hughey Judy K
Purchase Details
Closed on
Jun 8, 2016
Sold by
Hughey Julius T
Bought by
Terrell & Judy Hughey Living Trust
Purchase Details
Closed on
Oct 31, 1995
Sold by
Courembis Dorothy
Bought by
Hughey Julius T Judy K
Purchase Details
Closed on
Apr 13, 1995
Sold by
Kornblatt Norman I Jill A
Bought by
Courembis John P Dorothy
Create a Home Valuation Report for This Property
The Home Valuation Report is an in-depth analysis detailing your home's value as well as a comparison with similar homes in the area
Home Values in the Area
Average Home Value in this Area
Purchase History
| Date | Buyer | Sale Price | Title Company |
|---|---|---|---|
| Wachuku Chigozirim | $283,000 | -- | |
| Hughey Judy K | -- | -- | |
| Terrell & Judy Hughey Living Trust | -- | -- | |
| Hughey Julius T Judy K | $157,000 | -- | |
| Courembis John P Dorothy | $151,500 | -- |
Source: Public Records
Mortgage History
| Date | Status | Borrower | Loan Amount |
|---|---|---|---|
| Open | Wachuku Chigozirim | $268,850 | |
| Closed | Hughey Julius T Judy K | $0 |
Source: Public Records
Tax History Compared to Growth
Tax History
| Year | Tax Paid | Tax Assessment Tax Assessment Total Assessment is a certain percentage of the fair market value that is determined by local assessors to be the total taxable value of land and additions on the property. | Land | Improvement |
|---|---|---|---|---|
| 2025 | $4,301 | $173,540 | $30,000 | $143,540 |
| 2024 | $4,305 | $173,540 | $30,000 | $143,540 |
| 2023 | $3,762 | $173,540 | $30,000 | $143,540 |
| 2022 | $3,791 | $148,576 | $30,000 | $118,576 |
| 2021 | $3,400 | $130,712 | $24,000 | $106,712 |
| 2020 | $2,904 | $108,040 | $24,000 | $84,040 |
| 2019 | $2,904 | $108,040 | $24,000 | $84,040 |
| 2018 | $2,904 | $108,040 | $24,000 | $84,040 |
| 2017 | $645 | $95,996 | $24,000 | $71,996 |
| 2016 | $612 | $88,088 | $28,000 | $60,088 |
| 2015 | $652 | $88,088 | $28,000 | $60,088 |
| 2014 | $662 | $88,088 | $0 | $0 |
Source: Public Records
Map
Nearby Homes
- 2403 Bonshaw Ln
- 2563 Irwin Lake Overlook Rd SW
- 1239 Bonshaw Trail Unit 3
- 1227 Bonshaw Trail
- 1214 Bonshaw Trail
- 1209 Wilkes Way SW Unit 1
- 1884 Dovonshire Rd SW
- 1841 Edington Rd SW
- 1518 Sage Ridge Dr
- 1843 Edington Rd SW
- 2093 Breconridge Dr SW
- 2613 Lakefield Ct
- 1853 Edington Rd SW
- 994 Gentry Ln SW
- 1331 Wynford Chase SW Unit 1
- 1505 Old John Ward Rd SW
- 2341 Habersham Dr SW
- 2040 Hardwood Cir SW Unit 3
- 1265 Channel Park SW
- 1646 Desford Ct SW
- 1437 Fenwick Dr SW
- 1439 Fenwick Dr SW
- 1429 Fenwick Dr SW Unit 90
- 1429 Fenwick Dr SW
- 1441 Fenwick Dr SW
- 1438 Fenwick Dr SW
- 1436 Fenwick Dr SW
- 2366 Fenwick Ct SW
- 1427 Fenwick Dr SW
- 1427 Fenwick Dr SW Unit 89
- 1428 Fenwick Dr SW
- 2475 Hampton Glen Ct SW
- 1430 Fenwick Dr SW Unit 2
- 2364 Fenwick Ct SW Unit 1
- 1434 Fenwick Dr SW Unit 2
- 1440 Fenwick Dr SW
- 2473 Hampton Glen Ct SW
- 2365 Fenwick Ct SW Unit I
- 1432 Fenwick Dr SW
- 1426 Fenwick Dr SW