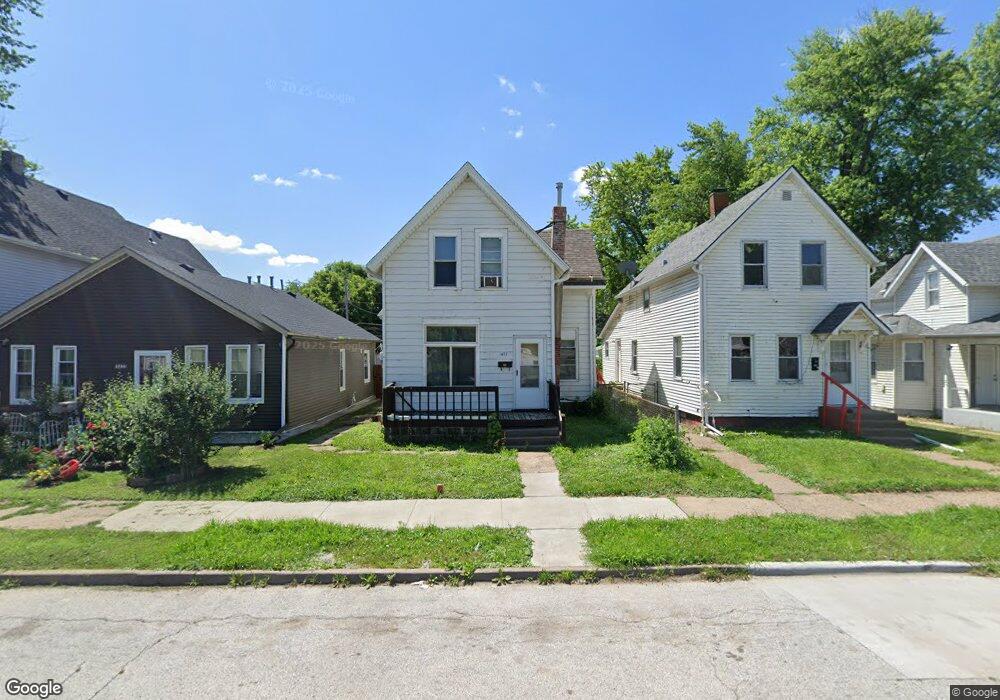
1437 W 4th St Davenport, IA 52802
Downtown Davenport NeighborhoodEstimated Value: $62,000 - $82,801
3
Beds
1
Bath
1,564
Sq Ft
$46/Sq Ft
Est. Value
About This Home
This home is located at 1437 W 4th St, Davenport, IA 52802 and is currently estimated at $71,200, approximately $45 per square foot. 1437 W 4th St is a home located in Scott County with nearby schools including Walnut Hill Elementary School, South Christian Elementary School, and Christian County Middle School.
Ownership History
Date
Name
Owned For
Owner Type
Purchase Details
Closed on
May 30, 2017
Sold by
Diaz Jose Luis and Diaz Susan M
Bought by
Ghd Property Llc
Current Estimated Value
Purchase Details
Closed on
Jun 8, 2015
Sold by
Diaz Gregorio
Bought by
Diaz Jose Luis
Create a Home Valuation Report for This Property
The Home Valuation Report is an in-depth analysis detailing your home's value as well as a comparison with similar homes in the area
Home Values in the Area
Average Home Value in this Area
Purchase History
| Date | Buyer | Sale Price | Title Company |
|---|---|---|---|
| Ghd Property Llc | -- | None Available | |
| Diaz Jose Luis | -- | Attorney |
Source: Public Records
Tax History Compared to Growth
Tax History
| Year | Tax Paid | Tax Assessment Tax Assessment Total Assessment is a certain percentage of the fair market value that is determined by local assessors to be the total taxable value of land and additions on the property. | Land | Improvement |
|---|---|---|---|---|
| 2025 | $928 | $62,900 | $4,410 | $58,490 |
| 2024 | $906 | $51,930 | $4,410 | $47,520 |
| 2023 | $1,174 | $51,930 | $4,410 | $47,520 |
| 2022 | $1,155 | $46,550 | $4,410 | $42,140 |
| 2021 | $998 | $46,550 | $4,410 | $42,140 |
| 2020 | $1,242 | $42,890 | $4,410 | $38,480 |
| 2019 | $880 | $39,220 | $4,410 | $34,810 |
| 2018 | $1,187 | $39,220 | $4,410 | $34,810 |
| 2017 | $1,104 | $37,390 | $4,410 | $32,980 |
| 2016 | $1,274 | $35,560 | $0 | $0 |
| 2015 | $778 | $36,380 | $0 | $0 |
| 2014 | $808 | $36,380 | $0 | $0 |
| 2013 | $794 | $0 | $0 | $0 |
| 2012 | -- | $34,270 | $4,460 | $29,810 |
Source: Public Records
Map
Nearby Homes
- 1410 W 4th St
- 1120 & 1124 W 3rd St
- 1538 W 3rd St
- 1614 W 3rd St
- 1445 W 7th St
- 1636 W 3rd St
- 422 N Marquette St
- 1701 W 8th St
- 1414 W 9th St
- 1604 W 9th St
- 1815 W 3rd St
- 1119 W 8th St
- 1309 Clay St
- 1111 W 8th St
- 817 N Marquette St
- 1824 W 8th St
- 1031 W 8th St
- 910 W 3rd St Unit 912
- 722 Vine St
- 1854 W 8th St