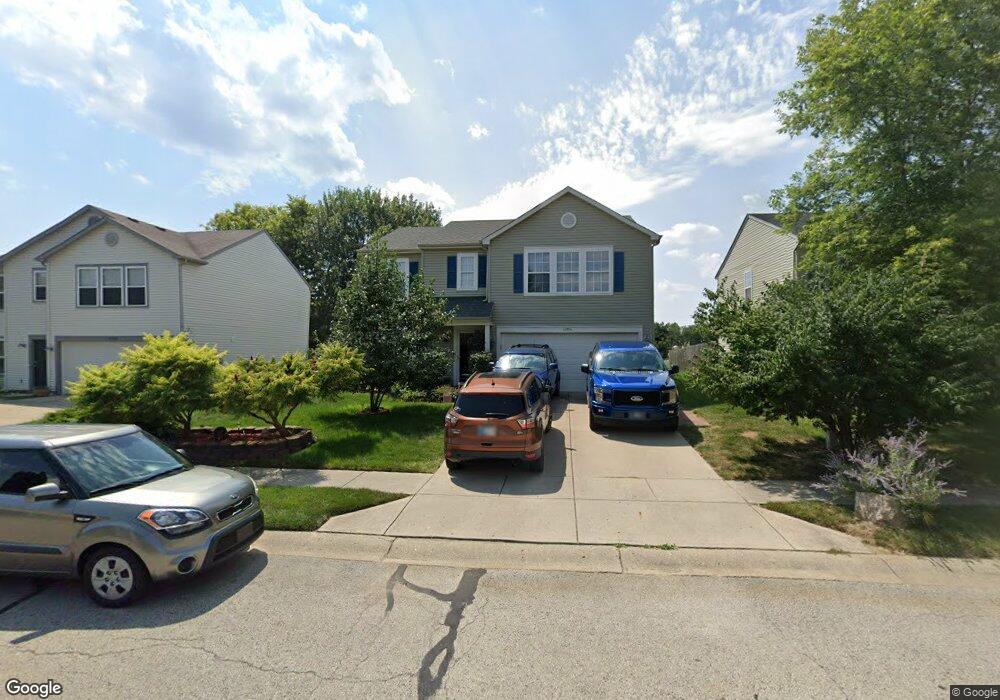
14374 Forsythia Ln Fishers, IN 46038
Estimated Value: $324,505 - $337,000
3
Beds
3
Baths
2,112
Sq Ft
$158/Sq Ft
Est. Value
About This Home
This home is located at 14374 Forsythia Ln, Fishers, IN 46038 and is currently estimated at $332,876, approximately $157 per square foot. 14374 Forsythia Ln is a home located in Hamilton County with nearby schools including Harrison Parkway Elementary School, Kinsey Elementary School, and Fishers Junior High School.
Ownership History
Date
Name
Owned For
Owner Type
Purchase Details
Closed on
Jul 20, 2009
Sold by
Flora Stacey L and Sampson Stacey Leann
Bought by
Flora Stacey L
Current Estimated Value
Home Financials for this Owner
Home Financials are based on the most recent Mortgage that was taken out on this home.
Original Mortgage
$118,487
Outstanding Balance
$75,102
Interest Rate
4.75%
Mortgage Type
FHA
Estimated Equity
$257,774
Purchase Details
Closed on
Apr 11, 2003
Sold by
Sampson Jeffrey T
Bought by
Sampson Stacey Leann
Home Financials for this Owner
Home Financials are based on the most recent Mortgage that was taken out on this home.
Original Mortgage
$108,000
Interest Rate
5.71%
Mortgage Type
New Conventional
Purchase Details
Closed on
Dec 17, 2001
Sold by
Jackson Corey D
Bought by
Sampson Jeffrey T and Sampson Stacey Leann
Home Financials for this Owner
Home Financials are based on the most recent Mortgage that was taken out on this home.
Original Mortgage
$100,000
Interest Rate
6.87%
Create a Home Valuation Report for This Property
The Home Valuation Report is an in-depth analysis detailing your home's value as well as a comparison with similar homes in the area
Home Values in the Area
Average Home Value in this Area
Purchase History
| Date | Buyer | Sale Price | Title Company |
|---|---|---|---|
| Flora Stacey L | -- | Ticor Title Insurance Co | |
| Sampson Stacey Leann | -- | -- | |
| Sampson Jeffrey T | -- | -- |
Source: Public Records
Mortgage History
| Date | Status | Borrower | Loan Amount |
|---|---|---|---|
| Open | Flora Stacey L | $118,487 | |
| Closed | Sampson Stacey Leann | $108,000 | |
| Closed | Sampson Jeffrey T | $100,000 |
Source: Public Records
Tax History Compared to Growth
Tax History
| Year | Tax Paid | Tax Assessment Tax Assessment Total Assessment is a certain percentage of the fair market value that is determined by local assessors to be the total taxable value of land and additions on the property. | Land | Improvement |
|---|---|---|---|---|
| 2024 | $2,672 | $259,200 | $36,200 | $223,000 |
| 2023 | $2,717 | $253,500 | $36,200 | $217,300 |
| 2022 | $2,451 | $219,400 | $36,200 | $183,200 |
| 2021 | $2,056 | $188,400 | $36,200 | $152,200 |
| 2020 | $3,942 | $171,700 | $36,200 | $135,500 |
| 2019 | $3,606 | $159,500 | $25,800 | $133,700 |
| 2018 | $3,485 | $154,000 | $25,800 | $128,200 |
| 2017 | $3,448 | $151,300 | $25,800 | $125,500 |
| 2016 | $3,173 | $142,900 | $25,800 | $117,100 |
| 2014 | $1,169 | $133,900 | $25,800 | $108,100 |
| 2013 | $1,169 | $128,300 | $25,900 | $102,400 |
Source: Public Records
Map
Nearby Homes
- 9989 Worthington Blvd
- 10182 Orange Blossom Trail
- 10057 Boysenberry Dr
- 9904 Worthington Blvd
- 9984 Gentry Dr
- 10190 Holly Berry Cir
- 14243 Holly Berry Cir
- 10270 Apple Blossom Cir
- 9760 Silver Leaf Dr Unit 701
- 14521 Stewart Cir
- 14041 Mimosa Ct
- 9686 Angelica Dr
- 14205 Shooting Star Dr
- 10343 Waveland Cir
- 10055 Plantana Blvd
- 9887 Cranberry Cir
- 10414 Bicknell Cir
- 13853 Oak Grove Ct
- 10093 Parkshore Dr
- 13854 Meadow Grass Way
- 14386 Forsythia Ln
- 14368 Forsythia Ln
- 10046 Weeping Cherry Dr
- 14398 Forsythia Ln
- 10090 Weeping Cherry Dr
- 10034 Weeping Cherry Dr
- 14410 Forsythia Ln
- 14375 Forsythia Ln
- 14387 Forsythia Ln
- 10102 Weeping Cherry Dr
- 10055 Weeping Cherry Dr
- 10067 Weeping Cherry Dr
- 14333 Gentry Dr
- 14422 Forsythia Ln
- 10079 Weeping Cherry Dr
- 14929 Gentry Dr
- 14411 Forsythia Ln
- 10099 Weeping Cherry Dr
- 10010 Weeping Cherry Dr
- 14434 Forsythia Ln