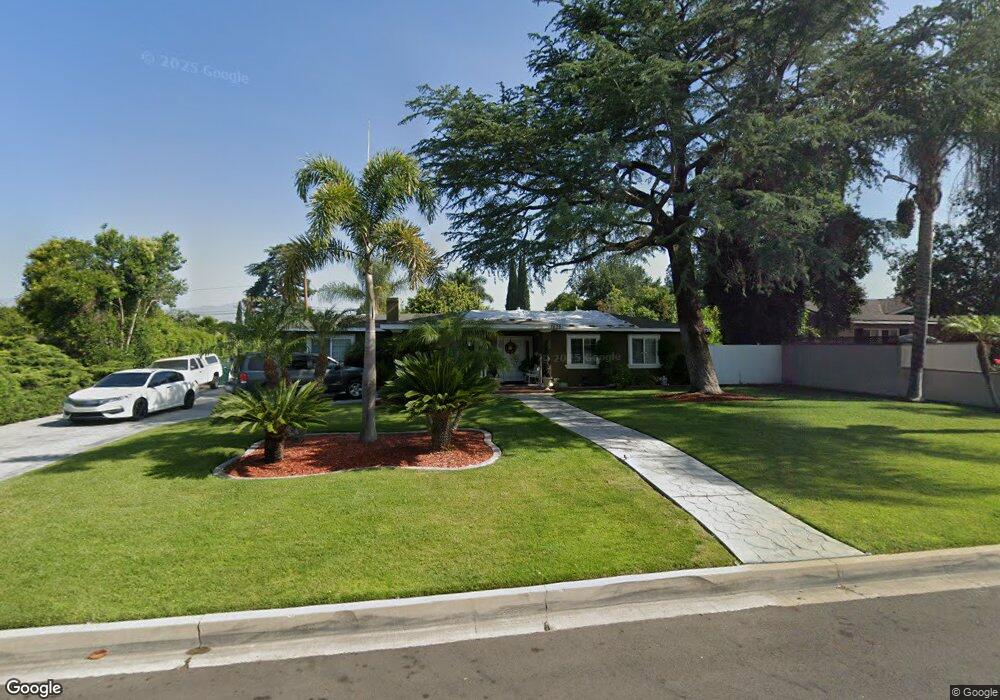
1439 E Portner St West Covina, CA 91791
Estimated Value: $1,010,000 - $1,086,133
3
Beds
2
Baths
1,736
Sq Ft
$604/Sq Ft
Est. Value
About This Home
This home is located at 1439 E Portner St, West Covina, CA 91791 and is currently estimated at $1,048,033, approximately $603 per square foot. 1439 E Portner St is a home located in Los Angeles County with nearby schools including Merced Elementary School, Hollencrest Middle School, and West Covina High School.
Ownership History
Date
Name
Owned For
Owner Type
Purchase Details
Closed on
Mar 5, 2007
Sold by
Fernandez Maria S
Bought by
Fernandez Jose Fernando
Current Estimated Value
Home Financials for this Owner
Home Financials are based on the most recent Mortgage that was taken out on this home.
Original Mortgage
$72,000
Interest Rate
6.29%
Mortgage Type
Stand Alone Second
Purchase Details
Closed on
Jan 25, 2007
Sold by
Wu Kuo Hsien
Bought by
Fernandez Jose Fernando
Home Financials for this Owner
Home Financials are based on the most recent Mortgage that was taken out on this home.
Original Mortgage
$72,000
Interest Rate
6.29%
Mortgage Type
Stand Alone Second
Purchase Details
Closed on
Oct 13, 2000
Sold by
Wu Peggy M
Bought by
Wu Kuo Hsien and Wu Peggy M
Home Financials for this Owner
Home Financials are based on the most recent Mortgage that was taken out on this home.
Original Mortgage
$125,000
Interest Rate
7.96%
Create a Home Valuation Report for This Property
The Home Valuation Report is an in-depth analysis detailing your home's value as well as a comparison with similar homes in the area
Purchase History
| Date | Buyer | Sale Price | Title Company |
|---|---|---|---|
| Fernandez Jose Fernando | -- | Fidelity National Title Co | |
| Fernandez Jose Fernando | $720,000 | Fidelity National Title Co | |
| Wu Kuo Hsien | -- | American Title Co |
Source: Public Records
Mortgage History
| Date | Status | Borrower | Loan Amount |
|---|---|---|---|
| Closed | Fernandez Jose Fernando | $72,000 | |
| Previous Owner | Fernandez Jose Fernando | $576,000 | |
| Previous Owner | Wu Kuo Hsien | $125,000 |
Source: Public Records
Tax History
| Year | Tax Paid | Tax Assessment Tax Assessment Total Assessment is a certain percentage of the fair market value that is determined by local assessors to be the total taxable value of land and additions on the property. | Land | Improvement |
|---|---|---|---|---|
| 2025 | $11,738 | $981,050 | $735,136 | $245,914 |
| 2024 | $11,738 | $961,815 | $720,722 | $241,093 |
| 2023 | $11,135 | $942,957 | $706,591 | $236,366 |
| 2022 | $10,712 | $878,000 | $655,000 | $223,000 |
| 2021 | $9,070 | $742,000 | $553,700 | $188,300 |
| 2019 | $9,082 | $742,000 | $553,700 | $188,300 |
| 2018 | $8,067 | $673,000 | $513,000 | $160,000 |
| 2016 | $6,588 | $572,000 | $436,000 | $136,000 |
| 2015 | $6,380 | $557,000 | $424,100 | $132,900 |
| 2014 | $5,651 | $482,000 | $367,000 | $115,000 |
Source: Public Records
Map
Nearby Homes
- 901 S Glenview Rd
- 1031 S Pima Ave
- 1601 Aspen Village Way
- 1799 Aspen Village Way Unit 12
- 1117 E Thackery St
- 1767 Aspen Village Way
- 910 S Donna Beth Ave
- 16559 Mcwood St
- 1529 Borden Ln
- 1124 S Cajon Ave
- 1717 Cabrillo
- 17047 E Alwood St
- 725 S Gaybar Ave
- 640 S Azusa Ave
- 1663 Caffrey Ln
- 17003 Dubesor St
- 1540 Potomac
- 1031 E Larkwood St
- 1516 Wimbledon Ct
- 401 S Cherrywood St
- 1433 E Portner St
- 1449 E Portner St
- 1440 E Vine Ave
- 1425 E Portner St
- 1505 E Portner St
- 1432 E Vine Ave
- 1444 E Vine Ave
- 1438 E Portner St
- 1432 E Portner St
- 1448 E Portner St
- 1448 E Vine Ave
- 1417 E Portner St
- 1513 E Portner St
- 1504 E Portner St
- 1424 E Portner St
- 1508 E Vine Ave
- 1416 E Vine Ave
- 1411 E Portner St
- 1416 E Portner St
- 1512 E Portner St
Your Personal Tour Guide
Ask me questions while you tour the home.