1439 Merle Hay Rd Des Moines, IA 50311
Merle Hay NeighborhoodEstimated Value: $240,000 - $271,000
3
Beds
1
Bath
1,596
Sq Ft
$161/Sq Ft
Est. Value
About This Home
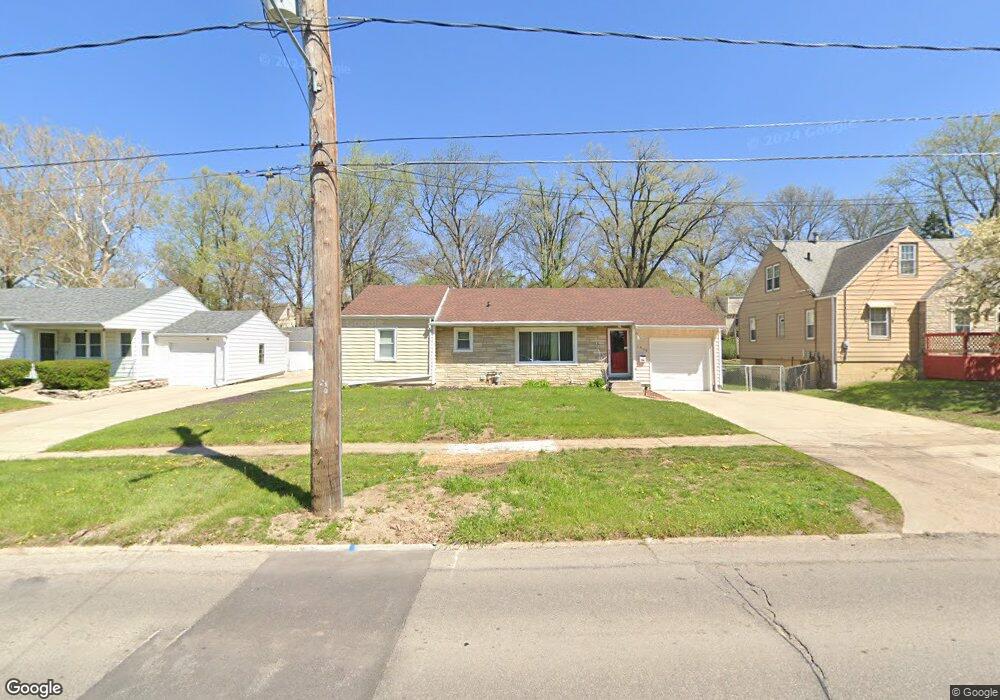
This home is located at 1439 Merle Hay Rd, Des Moines, IA 50311 and is currently estimated at $257,550, approximately $161 per square foot. 1439 Merle Hay Rd is a home located in Polk County with nearby schools including Windsor Elementary School, Merrill Middle School, and Roosevelt High School.
Ownership History
Date
Name
Owned For
Owner Type
Purchase Details
Closed on
Apr 22, 2015
Sold by
Wackens Ronald Ralph and Jorden Wackens Virginia A
Bought by
Jorden Wackens Virginia A
Current Estimated Value
Purchase Details
Closed on
Sep 9, 2011
Sold by
Pham David and Pham Lisa
Bought by
Wackens Ronald Ralph and Wackens Virgina A Jonden
Home Financials for this Owner
Home Financials are based on the most recent Mortgage that was taken out on this home.
Original Mortgage
$113,300
Outstanding Balance
$78,104
Interest Rate
4.4%
Mortgage Type
VA
Estimated Equity
$179,446
Purchase Details
Closed on
Aug 7, 1998
Sold by
Steinlage Ivan J and Steinlage Angela M
Bought by
Pham David and Tran Lisa
Home Financials for this Owner
Home Financials are based on the most recent Mortgage that was taken out on this home.
Original Mortgage
$76,738
Interest Rate
6.99%
Mortgage Type
FHA
Create a Home Valuation Report for This Property
The Home Valuation Report is an in-depth analysis detailing your home's value as well as a comparison with similar homes in the area
Home Values in the Area
Average Home Value in this Area
Purchase History
| Date | Buyer | Sale Price | Title Company |
|---|---|---|---|
| Jorden Wackens Virginia A | -- | None Available | |
| Wackens Ronald Ralph | $113,000 | None Available | |
| Pham David | $76,500 | -- |
Source: Public Records
Mortgage History
| Date | Status | Borrower | Loan Amount |
|---|---|---|---|
| Open | Wackens Ronald Ralph | $113,300 | |
| Previous Owner | Pham David | $76,738 |
Source: Public Records
Tax History Compared to Growth
Tax History
| Year | Tax Paid | Tax Assessment Tax Assessment Total Assessment is a certain percentage of the fair market value that is determined by local assessors to be the total taxable value of land and additions on the property. | Land | Improvement |
|---|---|---|---|---|
| 2025 | $4,246 | $247,000 | $48,300 | $198,700 |
| 2024 | $4,246 | $221,000 | $42,500 | $178,500 |
| 2023 | $4,246 | $221,000 | $42,500 | $178,500 |
| 2022 | $4,210 | $192,400 | $38,400 | $154,000 |
| 2021 | $4,006 | $192,400 | $38,400 | $154,000 |
| 2020 | $4,154 | $172,400 | $34,200 | $138,200 |
| 2019 | $4,360 | $172,400 | $34,200 | $138,200 |
| 2018 | $3,770 | $153,800 | $29,900 | $123,900 |
| 2017 | $3,316 | $153,800 | $29,900 | $123,900 |
| 2016 | $3,224 | $134,400 | $26,000 | $108,400 |
| 2015 | $3,224 | $134,400 | $26,000 | $108,400 |
| 2014 | $3,118 | $129,400 | $24,600 | $104,800 |
Source: Public Records
Map
Nearby Homes
- 1435 Merle Hay Rd
- 1449 Merle Hay Rd
- 1431 Merle Hay Rd
- 1438 57th Place
- 1442 57th Place
- 1434 57th Place
- 1505 Merle Hay Rd
- 1446 57th Place
- 5801 Clark St
- 1427 Merle Hay Rd
- 1430 57th Place
- 1500 57th Place
- 1426 57th Place
- 1423 Merle Hay Rd
- 5805 Clark St
- 1509 Merle Hay Rd
- 1500 Merle Hay Rd
- 5804 Clark St
- 1422 57th Place
- 5809 Clark St