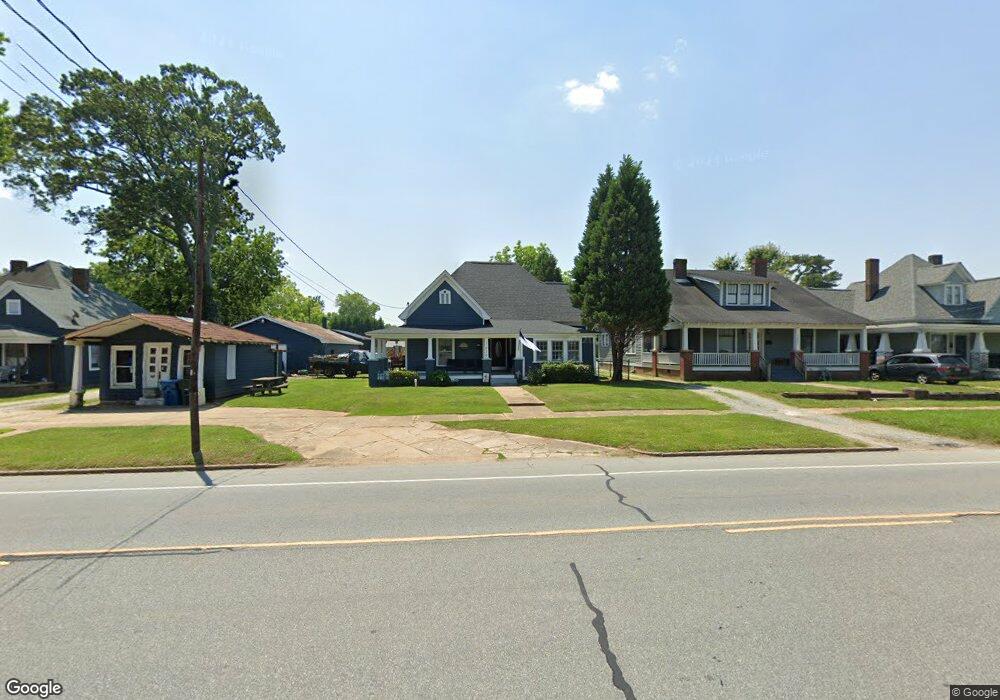
1439 N Main St Salisbury, NC 28144
Estimated Value: $233,776 - $263,000
--
Bed
1
Bath
1,721
Sq Ft
$144/Sq Ft
Est. Value
About This Home
This home is located at 1439 N Main St, Salisbury, NC 28144 and is currently estimated at $247,694, approximately $143 per square foot. 1439 N Main St is a home located in Rowan County with nearby schools including Carroll T Overton Elementary School, Knox Middle School, and North Rowan Middle School.
Ownership History
Date
Name
Owned For
Owner Type
Purchase Details
Closed on
Jul 11, 2017
Sold by
Nottingham Kenneth L and Nottingham Crystal
Bought by
Nottingham Kenneth L
Current Estimated Value
Home Financials for this Owner
Home Financials are based on the most recent Mortgage that was taken out on this home.
Original Mortgage
$72,900
Interest Rate
3.94%
Mortgage Type
New Conventional
Create a Home Valuation Report for This Property
The Home Valuation Report is an in-depth analysis detailing your home's value as well as a comparison with similar homes in the area
Home Values in the Area
Average Home Value in this Area
Purchase History
| Date | Buyer | Sale Price | Title Company |
|---|---|---|---|
| Nottingham Kenneth L | -- | None Available |
Source: Public Records
Mortgage History
| Date | Status | Borrower | Loan Amount |
|---|---|---|---|
| Closed | Nottingham Kenneth L | $72,900 |
Source: Public Records
Tax History Compared to Growth
Tax History
| Year | Tax Paid | Tax Assessment Tax Assessment Total Assessment is a certain percentage of the fair market value that is determined by local assessors to be the total taxable value of land and additions on the property. | Land | Improvement |
|---|---|---|---|---|
| 2025 | $2,559 | $213,984 | $35,425 | $178,559 |
| 2024 | $2,559 | $213,984 | $35,425 | $178,559 |
| 2023 | $2,559 | $213,984 | $35,425 | $178,559 |
| 2022 | $1,623 | $117,862 | $27,250 | $90,612 |
| 2021 | $1,623 | $117,862 | $27,250 | $90,612 |
| 2020 | $1,623 | $117,862 | $27,250 | $90,612 |
| 2019 | $1,623 | $117,862 | $27,250 | $90,612 |
| 2018 | $1,424 | $104,783 | $27,250 | $77,533 |
| 2017 | $1,416 | $104,783 | $27,250 | $77,533 |
| 2016 | $1,377 | $104,783 | $27,250 | $77,533 |
| 2015 | $1,386 | $104,783 | $27,250 | $77,533 |
| 2014 | $1,272 | $97,312 | $25,615 | $71,697 |
Source: Public Records
Map
Nearby Homes