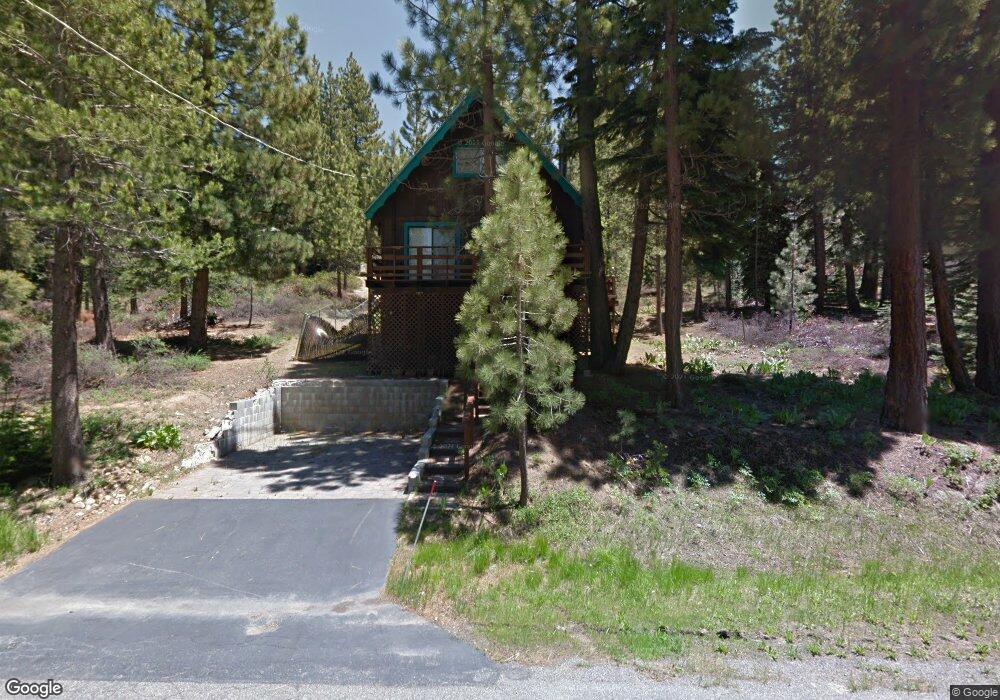
1439 Pebble Beach Dr South Lake Tahoe, CA 96150
Estimated Value: $557,007 - $673,000
3
Beds
2
Baths
1,268
Sq Ft
$467/Sq Ft
Est. Value
About This Home
This home is located at 1439 Pebble Beach Dr, South Lake Tahoe, CA 96150 and is currently estimated at $591,752, approximately $466 per square foot. 1439 Pebble Beach Dr is a home located in El Dorado County with nearby schools including Sierra House Elementary School, South Tahoe Middle School, and South Tahoe High School.
Ownership History
Date
Name
Owned For
Owner Type
Purchase Details
Closed on
Dec 28, 2020
Sold by
Vigil Victor L and Vigil Catherine B
Bought by
Vigil Michael and Vigil Dean
Current Estimated Value
Purchase Details
Closed on
Dec 25, 2020
Sold by
Vigil Victor L and Vigil Catherine B
Bought by
Vigil Victor L and Vigil Catherine B
Purchase Details
Closed on
Oct 10, 2013
Sold by
Vigil Victor L and Vigil Catherine B
Bought by
Vigil Victor L and Vigil Catherine B
Purchase Details
Closed on
May 5, 1998
Sold by
Park Dale R
Bought by
Vigil Victor L and Vigil Catherine B
Purchase Details
Closed on
Dec 29, 1993
Sold by
Park Lynne L
Bought by
Park Dale R
Home Financials for this Owner
Home Financials are based on the most recent Mortgage that was taken out on this home.
Original Mortgage
$74,600
Interest Rate
7.24%
Create a Home Valuation Report for This Property
The Home Valuation Report is an in-depth analysis detailing your home's value as well as a comparison with similar homes in the area
Home Values in the Area
Average Home Value in this Area
Purchase History
| Date | Buyer | Sale Price | Title Company |
|---|---|---|---|
| Vigil Michael | -- | None Available | |
| Vigil Victor L | -- | None Available | |
| Vigil Victor L | -- | None Available | |
| Vigil Victor L | $117,500 | Old Republic Title Company | |
| Park Dale R | -- | First American Title Co |
Source: Public Records
Mortgage History
| Date | Status | Borrower | Loan Amount |
|---|---|---|---|
| Previous Owner | Park Dale R | $74,600 |
Source: Public Records
Tax History Compared to Growth
Tax History
| Year | Tax Paid | Tax Assessment Tax Assessment Total Assessment is a certain percentage of the fair market value that is determined by local assessors to be the total taxable value of land and additions on the property. | Land | Improvement |
|---|---|---|---|---|
| 2025 | $2,069 | $187,581 | $47,882 | $139,699 |
| 2024 | $2,069 | $183,904 | $46,944 | $136,960 |
| 2023 | $2,034 | $180,299 | $46,024 | $134,275 |
| 2022 | $2,014 | $176,765 | $45,122 | $131,643 |
| 2021 | $1,981 | $173,300 | $44,238 | $129,062 |
| 2020 | $1,956 | $171,524 | $43,785 | $127,739 |
| 2019 | $1,947 | $168,162 | $42,927 | $125,235 |
| 2018 | $1,905 | $164,866 | $42,086 | $122,780 |
| 2017 | $1,876 | $161,634 | $41,261 | $120,373 |
| 2016 | $1,839 | $158,465 | $40,452 | $118,013 |
| 2015 | $1,748 | $156,088 | $39,846 | $116,242 |
| 2014 | $1,748 | $153,032 | $39,066 | $113,966 |
Source: Public Records
Map
Nearby Homes
- 1578 Skyline Dr
- 1428 Skyline Dr
- 1575 Crystal Air Dr
- 1579 Crystal Air Dr
- 1644 Crystal Air Dr
- 1580 Boca Raton Dr
- 1671 Crystal Air Dr
- 1678 Tionontati St
- 1713 Tionontati St
- 1617 Cree St
- 1589 Cree St
- 1541 Arapahoe St
- 1513 Cree St
- 1656 Oglala St
- 1431 Vanderhoof Rd
- 1442 Vanderhoof Rd
- 1318 Pine Valley Rd
- 1675 Arapahoe St
- 1801 Meadow Vale Dr
- 1623 Hekpa Dr
- 1447 Pebble Beach Dr
- 1615 Thunderbird Dr
- 1621 Thunderbird Dr
- 1609 Thunderbird Dr
- 1453 Pebble Beach Dr
- 1627 Thunderbird Dr
- 1444 Pebble Beach Dr
- 1450 Pebble Beach Dr
- 1603 Thunderbird Dr
- 1421 Pebble Beach Dr
- 1461 Pebble Beach Dr
- 1593 Thunderbird Dr
- 1419 Pebble Beach Rd
- 1513 Apple Valley Dr
- 1614 Thunderbird Dr
- 1467 Pebble Beach Dr
- 1608 Thunderbird Dr
- 1527 Apple Valley Dr
- 1414 Pebble Beach Dr
- 1468 Pebble Beach Dr