1439 S Prairie Ave Unit 74 Chicago, IL 60605
Central Station NeighborhoodEstimated Value: $834,471 - $1,218,000
--
Bed
--
Bath
--
Sq Ft
3.73
Acres
About This Home
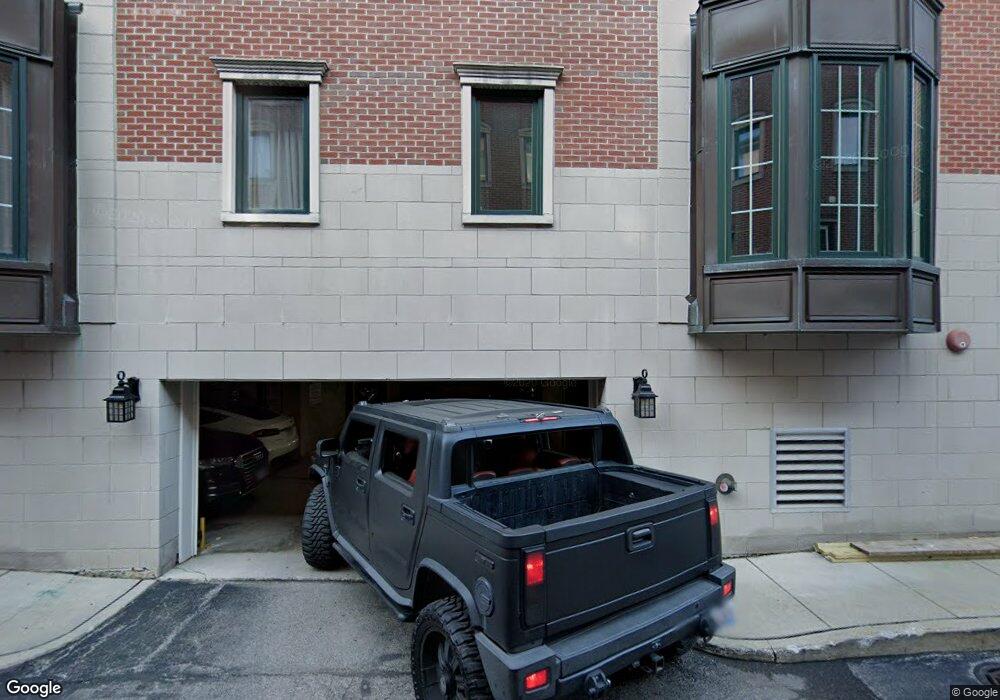
This home is located at 1439 S Prairie Ave Unit 74, Chicago, IL 60605 and is currently estimated at $956,118. 1439 S Prairie Ave Unit 74 is a home located in Cook County with nearby schools including South Loop Elementary School, Wendell Phillips Academy High School, and Old St. Marys School.
Ownership History
Date
Name
Owned For
Owner Type
Purchase Details
Closed on
Dec 10, 2019
Sold by
Bienia Konrad and Bienia Kathleen
Bought by
Bienia Konrad and Bienia Kathleen
Current Estimated Value
Purchase Details
Closed on
Jan 30, 2016
Sold by
Bienia Konrad and Bienia Kathleen
Bought by
Bienia Konrad and Bienia Kathleen
Purchase Details
Closed on
Sep 18, 2015
Sold by
Judd Dennis R and Kammann Judd Nan
Bought by
Bienia Konrad and Bienia Kathleen
Home Financials for this Owner
Home Financials are based on the most recent Mortgage that was taken out on this home.
Original Mortgage
$595,000
Outstanding Balance
$468,765
Interest Rate
4%
Mortgage Type
New Conventional
Estimated Equity
$487,353
Purchase Details
Closed on
Mar 15, 2002
Sold by
Prairie Place Ltd Partnership
Bought by
Judd Dennis R and Kammann Judd Nan
Create a Home Valuation Report for This Property
The Home Valuation Report is an in-depth analysis detailing your home's value as well as a comparison with similar homes in the area
Home Values in the Area
Average Home Value in this Area
Purchase History
| Date | Buyer | Sale Price | Title Company |
|---|---|---|---|
| Bienia Konrad | -- | None Available | |
| Bienia Konrad | -- | Attoreny | |
| Bienia Konrad | $707,000 | Chicago Title Insurance Co | |
| Judd Dennis R | $516,000 | -- |
Source: Public Records
Mortgage History
| Date | Status | Borrower | Loan Amount |
|---|---|---|---|
| Open | Bienia Konrad | $595,000 |
Source: Public Records
Tax History Compared to Growth
Tax History
| Year | Tax Paid | Tax Assessment Tax Assessment Total Assessment is a certain percentage of the fair market value that is determined by local assessors to be the total taxable value of land and additions on the property. | Land | Improvement |
|---|---|---|---|---|
| 2024 | $14,305 | $78,880 | $39,100 | $39,780 |
| 2023 | $13,921 | $70,890 | $26,500 | $44,390 |
| 2022 | $13,921 | $70,890 | $26,500 | $44,390 |
| 2021 | $13,626 | $70,890 | $26,500 | $44,390 |
| 2020 | $14,074 | $65,643 | $23,195 | $42,448 |
| 2019 | $14,315 | $71,248 | $23,195 | $48,053 |
| 2018 | $14,074 | $71,248 | $23,195 | $48,053 |
| 2017 | $13,173 | $61,195 | $19,053 | $42,142 |
| 2016 | $12,257 | $61,195 | $19,053 | $42,142 |
| 2015 | $11,214 | $61,195 | $19,053 | $42,142 |
| 2014 | $8,776 | $51,703 | $17,603 | $34,100 |
| 2013 | $8,584 | $51,703 | $17,603 | $34,100 |
Source: Public Records
Map
Nearby Homes
- 1429 S Prairie Ave
- 1436 S Prairie Ave Unit I
- 1335 S Prairie Ave Unit 1609
- 1335 S Prairie Ave Unit 1802
- 1335 S Prairie Ave Unit 1504
- 1335 S Prairie Ave Unit 2005
- 1478 S Prairie Ave Unit E
- 233 E 13th St Unit 601
- 233 E 13th St Unit 1209
- 233 E 13th St Unit 1204
- 233 E 13th St Unit 804
- 233 E 13th St Unit 2210
- 233 E 13th St Unit GU200
- 125 E 13th St Unit 1113
- 125 E 13th St Unit 808
- 125 E 13th St Unit 1213
- 125 E 13th St Unit 814
- 1502 S Prairie Ave Unit B
- 1439 S Michigan Ave Unit 103
- 1515 S Prairie Ave Unit 1008
- 1435 S Prairie Ave Unit A
- 1435 S Prairie Ave Unit L
- 1435 S Prairie Ave Unit G
- 1435 S Prairie Ave Unit R
- 1435 S Prairie Ave Unit Q
- 1435 S Prairie Ave Unit D
- 1435 S Prairie Ave Unit K
- 1435 S Prairie Ave Unit H
- 1435 S Prairie Ave
- 1435 S Prairie Ave Unit P
- 1435 S Prairie Ave Unit O
- 1435 S Prairie Ave Unit M
- 1435 S Prairie Ave Unit H47
- 1435 S Prairie Ave Unit H44
- 1435 S Prairie Ave Unit G53
- 1435 S Prairie Ave Unit D48
- 1435 S Prairie Ave Unit F50
- 1435 S Prairie Ave Unit G52
- 1435 S Prairie Ave Unit D37
- 1435 S Prairie Ave Unit E39