143R Tyler St Methuen, MA 01844
The West End NeighborhoodEstimated Value: $550,000 - $626,550
3
Beds
2
Baths
1,250
Sq Ft
$475/Sq Ft
Est. Value
About This Home
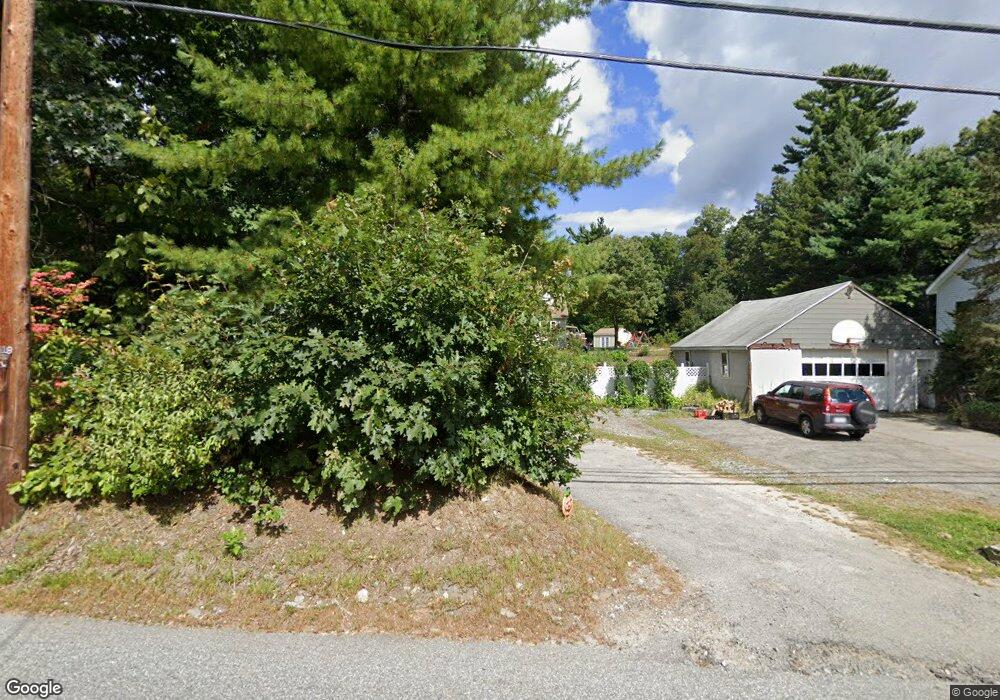
This home is located at 143R Tyler St, Methuen, MA 01844 and is currently estimated at $593,638, approximately $474 per square foot. 143R Tyler St is a home located in Essex County with nearby schools including Marsh Grammar School, South Point Elementary School, and Methuen High School.
Ownership History
Date
Name
Owned For
Owner Type
Purchase Details
Closed on
Oct 24, 2017
Sold by
Digloria John J
Bought by
143R Tyler Street Rt and Digloria
Current Estimated Value
Purchase Details
Closed on
Oct 19, 2015
Sold by
Digloria Aaron and Digloria John J
Bought by
143R Tyler Street Rt and Digloria
Purchase Details
Closed on
Sep 12, 2006
Sold by
Digloria John J and Digloria Linda L
Bought by
Digloria Aaron and Digloria John J
Create a Home Valuation Report for This Property
The Home Valuation Report is an in-depth analysis detailing your home's value as well as a comparison with similar homes in the area
Home Values in the Area
Average Home Value in this Area
Purchase History
| Date | Buyer | Sale Price | Title Company |
|---|---|---|---|
| 143R Tyler Street Rt | -- | -- | |
| 143R Tyler Street Rt | -- | -- | |
| 143R Tyler Street Rt | -- | -- | |
| 143R Tyler Street Rt | -- | -- | |
| 143R Tyler Street Rt | -- | -- | |
| 143R Tyler Street Rt | -- | -- | |
| Digloria Aaron | -- | -- | |
| Digloria Aaron | -- | -- | |
| Digloria Aaron | -- | -- |
Source: Public Records
Tax History Compared to Growth
Tax History
| Year | Tax Paid | Tax Assessment Tax Assessment Total Assessment is a certain percentage of the fair market value that is determined by local assessors to be the total taxable value of land and additions on the property. | Land | Improvement |
|---|---|---|---|---|
| 2025 | $6,077 | $574,400 | $271,600 | $302,800 |
| 2024 | $5,830 | $536,800 | $225,500 | $311,300 |
| 2023 | $5,423 | $463,500 | $201,300 | $262,200 |
| 2022 | $5,033 | $385,700 | $161,000 | $224,700 |
| 2021 | $4,783 | $362,600 | $153,000 | $209,600 |
| 2020 | $4,793 | $356,600 | $153,000 | $203,600 |
| 2019 | $4,745 | $334,400 | $144,900 | $189,500 |
| 2018 | $5,377 | $325,200 | $144,900 | $180,300 |
| 2017 | $4,492 | $306,600 | $144,900 | $161,700 |
| 2016 | $4,310 | $291,000 | $144,900 | $146,100 |
| 2015 | $4,135 | $283,200 | $144,900 | $138,300 |
Source: Public Records
Map
Nearby Homes