Estimated Value: $411,000 - $472,000
3
Beds
2
Baths
1,171
Sq Ft
$385/Sq Ft
Est. Value
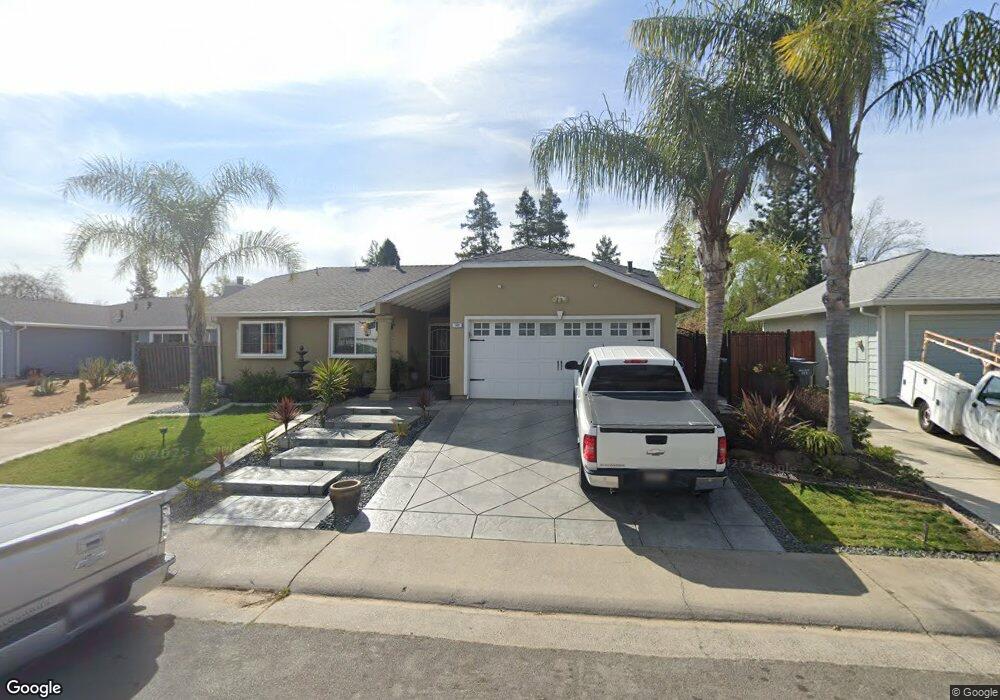
About This Home
This home is located at 144 Chaps Ct, Galt, CA 95632 and is currently estimated at $450,341, approximately $384 per square foot. 144 Chaps Ct is a home located in Sacramento County with nearby schools including Valley Oaks Elementary School, Robert L. McCaffrey Middle School, and Galt High School.
Ownership History
Date
Name
Owned For
Owner Type
Purchase Details
Closed on
Apr 4, 2019
Sold by
Cabrera Soto Armando and Valdevinos Angelica Ochoa
Bought by
Cabrera Soto Armando and Valdevinos Angelica Ochoa
Current Estimated Value
Home Financials for this Owner
Home Financials are based on the most recent Mortgage that was taken out on this home.
Original Mortgage
$127,000
Outstanding Balance
$111,656
Interest Rate
4.3%
Mortgage Type
New Conventional
Estimated Equity
$338,685
Purchase Details
Closed on
Apr 8, 2009
Sold by
Fdic
Bought by
Cabrera Armando and Valdevinos Angelica Ochoa
Home Financials for this Owner
Home Financials are based on the most recent Mortgage that was taken out on this home.
Original Mortgage
$113,686
Interest Rate
5.17%
Mortgage Type
Purchase Money Mortgage
Purchase Details
Closed on
Jan 13, 2009
Sold by
Reyes Eduardo Sanchez
Bought by
Indymac Federal Bank Fsb
Purchase Details
Closed on
Aug 31, 2005
Sold by
Pelayo Laura
Bought by
Reyes Eduardo Sanchez
Home Financials for this Owner
Home Financials are based on the most recent Mortgage that was taken out on this home.
Original Mortgage
$50,000
Interest Rate
5.76%
Mortgage Type
Credit Line Revolving
Purchase Details
Closed on
Dec 19, 2003
Sold by
Pelayo Laura
Bought by
Reyes Eduardo Sanchez
Home Financials for this Owner
Home Financials are based on the most recent Mortgage that was taken out on this home.
Original Mortgage
$207,900
Interest Rate
6.99%
Mortgage Type
Purchase Money Mortgage
Purchase Details
Closed on
Mar 30, 1998
Sold by
Federal National Mortgage Association
Bought by
Rueb Brian and Rueb Kathy
Home Financials for this Owner
Home Financials are based on the most recent Mortgage that was taken out on this home.
Original Mortgage
$106,208
Interest Rate
7.15%
Mortgage Type
FHA
Purchase Details
Closed on
Nov 26, 1997
Sold by
Rojas Jose M and Rojas Sandra L
Bought by
Federal National Mortgage Association
Create a Home Valuation Report for This Property
The Home Valuation Report is an in-depth analysis detailing your home's value as well as a comparison with similar homes in the area
Home Values in the Area
Average Home Value in this Area
Purchase History
| Date | Buyer | Sale Price | Title Company |
|---|---|---|---|
| Cabrera Soto Armando | -- | Orange Coast Ttl Co Of Nocal | |
| Cabrera Armando | $110,000 | Lsi Title Company | |
| Indymac Federal Bank Fsb | $139,500 | Accommodation | |
| Reyes Eduardo Sanchez | -- | Financial Title Company | |
| Reyes Eduardo Sanchez | -- | Chicago Title Co | |
| Reyes Eduardo Sanchez | $231,000 | Chicago Title Co | |
| Rueb Brian | $107,000 | Chicago Title Co | |
| Federal National Mortgage Association | $97,545 | First Southwestern Title Co |
Source: Public Records
Mortgage History
| Date | Status | Borrower | Loan Amount |
|---|---|---|---|
| Open | Cabrera Soto Armando | $127,000 | |
| Closed | Cabrera Armando | $113,686 | |
| Previous Owner | Reyes Eduardo Sanchez | $50,000 | |
| Previous Owner | Reyes Eduardo Sanchez | $207,900 | |
| Previous Owner | Rueb Brian | $106,208 |
Source: Public Records
Tax History
| Year | Tax Paid | Tax Assessment Tax Assessment Total Assessment is a certain percentage of the fair market value that is determined by local assessors to be the total taxable value of land and additions on the property. | Land | Improvement |
|---|---|---|---|---|
| 2025 | $1,947 | $184,027 | $51,502 | $132,525 |
| 2024 | $1,947 | $180,420 | $50,493 | $129,927 |
| 2023 | $1,912 | $176,883 | $49,503 | $127,380 |
| 2022 | $1,834 | $173,416 | $48,533 | $124,883 |
| 2021 | $1,834 | $170,017 | $47,582 | $122,435 |
| 2020 | $1,818 | $168,275 | $47,095 | $121,180 |
| 2019 | $1,772 | $164,976 | $46,172 | $118,804 |
| 2018 | $1,342 | $124,487 | $45,267 | $79,220 |
| 2017 | $1,288 | $122,047 | $44,380 | $77,667 |
| 2016 | $1,236 | $119,655 | $43,510 | $76,145 |
| 2015 | $1,192 | $117,859 | $42,857 | $75,002 |
| 2014 | $1,188 | $115,551 | $42,018 | $73,533 |
Source: Public Records
Map
Nearby Homes
Your Personal Tour Guide
Ask me questions while you tour the home.