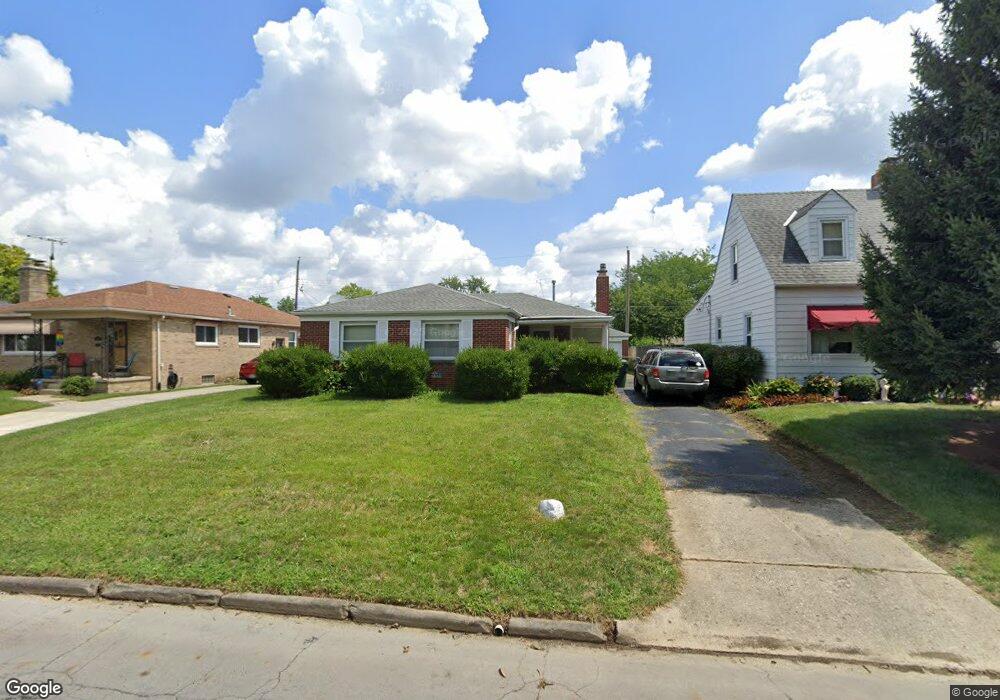
144 S Sylvan Ave Columbus, OH 43204
Westgate NeighborhoodEstimated Value: $235,000 - $270,000
4
Beds
2
Baths
1,197
Sq Ft
$214/Sq Ft
Est. Value
About This Home
This home is located at 144 S Sylvan Ave, Columbus, OH 43204 and is currently estimated at $256,413, approximately $214 per square foot. 144 S Sylvan Ave is a home located in Franklin County with nearby schools including Westgate Alternative Elementary School, Westmoor Middle School, and West High School.
Ownership History
Date
Name
Owned For
Owner Type
Purchase Details
Closed on
Dec 31, 2014
Sold by
Farrell John P and Farrell Barbara L
Bought by
Farrell Barbara L and Farrell John P
Current Estimated Value
Home Financials for this Owner
Home Financials are based on the most recent Mortgage that was taken out on this home.
Original Mortgage
$132,000
Outstanding Balance
$126,683
Interest Rate
2.66%
Mortgage Type
Reverse Mortgage Home Equity Conversion Mortgage
Estimated Equity
$129,730
Purchase Details
Closed on
Sep 10, 2004
Sold by
Farrell Darren M and Farrell Samantha K
Bought by
Mccarty Janet A
Purchase Details
Closed on
May 20, 2003
Sold by
Farrell Darren M and Farrell Samantha K
Bought by
Farrell Darren M and Farrell Samantha K
Home Financials for this Owner
Home Financials are based on the most recent Mortgage that was taken out on this home.
Original Mortgage
$114,000
Interest Rate
5.71%
Mortgage Type
Purchase Money Mortgage
Purchase Details
Closed on
Jan 26, 1994
Bought by
Farrell Darren M
Purchase Details
Closed on
Aug 1, 1984
Purchase Details
Closed on
Dec 1, 1983
Create a Home Valuation Report for This Property
The Home Valuation Report is an in-depth analysis detailing your home's value as well as a comparison with similar homes in the area
Home Values in the Area
Average Home Value in this Area
Purchase History
| Date | Buyer | Sale Price | Title Company |
|---|---|---|---|
| Farrell Barbara L | -- | Title Source | |
| Mccarty Janet A | $120,000 | Ohio Title | |
| Farrell Darren M | -- | -- | |
| Farrell Darren M | $72,000 | -- | |
| -- | $62,900 | -- | |
| -- | $56,900 | -- |
Source: Public Records
Mortgage History
| Date | Status | Borrower | Loan Amount |
|---|---|---|---|
| Open | Farrell Barbara L | $132,000 | |
| Previous Owner | Farrell Darren M | $114,000 |
Source: Public Records
Tax History Compared to Growth
Tax History
| Year | Tax Paid | Tax Assessment Tax Assessment Total Assessment is a certain percentage of the fair market value that is determined by local assessors to be the total taxable value of land and additions on the property. | Land | Improvement |
|---|---|---|---|---|
| 2024 | $3,091 | $78,680 | $21,630 | $57,050 |
| 2023 | $3,080 | $78,680 | $21,630 | $57,050 |
| 2022 | $3,820 | $49,640 | $8,160 | $41,480 |
| 2021 | $2,125 | $49,640 | $8,160 | $41,480 |
| 2020 | $2,127 | $49,640 | $8,160 | $41,480 |
| 2019 | $1,953 | $40,950 | $6,790 | $34,160 |
| 2018 | $2,220 | $40,950 | $6,790 | $34,160 |
| 2017 | $1,952 | $40,950 | $6,790 | $34,160 |
| 2016 | $1,911 | $37,600 | $7,740 | $29,860 |
| 2015 | $2,261 | $37,600 | $7,740 | $29,860 |
| 2014 | $2,267 | $37,600 | $7,740 | $29,860 |
| 2013 | $917 | $39,585 | $8,155 | $31,430 |
Source: Public Records
Map
Nearby Homes
- 195 S Sylvan Ave
- 79 S Southampton Ave
- 133 S Brinker Ave
- 253 Powhatan Ave
- 43 Letchworth Ave
- 30 Demorest Rd
- 0 S Brinker Ave
- 32 Orel Ave
- 267 S Westgate Ave
- 328 S Southampton Ave
- 3096 Ellis Place
- 36-38 Orel Ave
- 66 N Brinker Ave
- 113 N Brinker Ave Unit 115
- 58 Binns Blvd
- 119 N Westgate Ave
- 160 N Sylvan Ave
- 75 N Huron Ave
- 3100 Steele Ave
- 180 N Sylvan Ave
- 150 S Sylvan Ave
- 136 S Sylvan Ave
- 156 S Sylvan Ave
- 130 S Sylvan Ave
- 143 Powhatan Ave
- 149 Powhatan Ave
- 135 Powhatan Ave
- 124 S Sylvan Ave
- 164 S Sylvan Ave
- 141 S Sylvan Ave
- 129 Powhatan Ave
- 155 Powhatan Ave
- 135 S Sylvan Ave
- 149 S Sylvan Ave
- 155 S Sylvan Ave
- 129 S Sylvan Ave
- 163 Powhatan Ave
- 123 Powhatan Ave
- 170 S Sylvan Ave
- 121 S Sylvan Ave