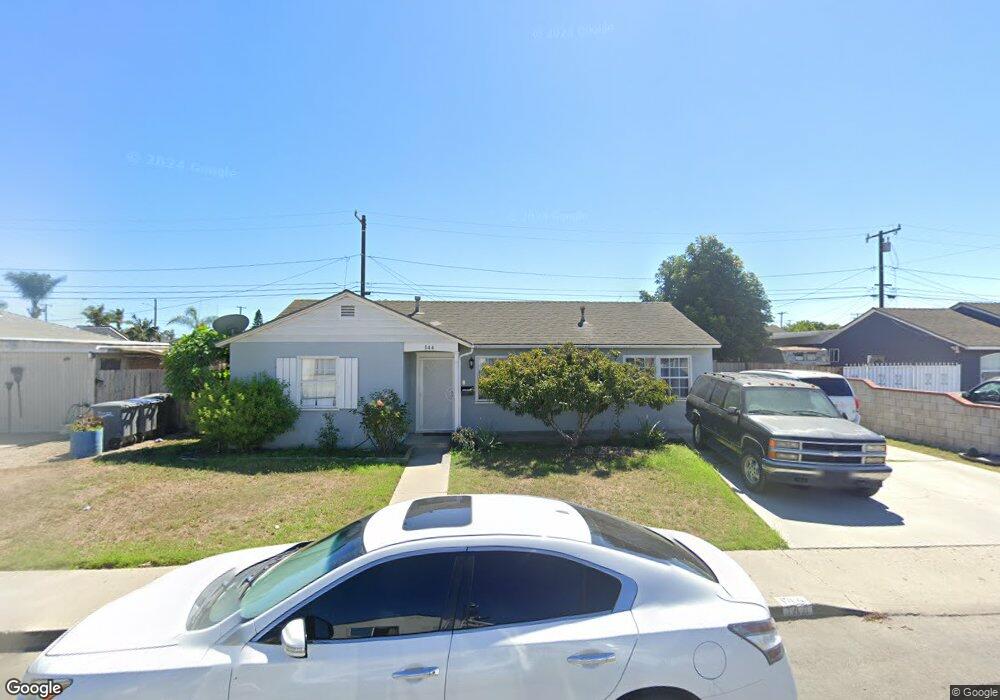
144 Thomas Ave Oxnard, CA 93033
Blackstock North NeighborhoodEstimated Value: $625,000 - $711,000
3
Beds
1
Bath
752
Sq Ft
$892/Sq Ft
Est. Value
About This Home
This home is located at 144 Thomas Ave, Oxnard, CA 93033 and is currently estimated at $670,896, approximately $892 per square foot. 144 Thomas Ave is a home located in Ventura County with nearby schools including Ansgar Larsen Elementary School, Channel Islands High School, and Santa Clara High School.
Ownership History
Date
Name
Owned For
Owner Type
Purchase Details
Closed on
Jul 26, 2006
Sold by
Whitby Shizuko K
Bought by
Morales Elva
Current Estimated Value
Home Financials for this Owner
Home Financials are based on the most recent Mortgage that was taken out on this home.
Original Mortgage
$103,800
Outstanding Balance
$61,961
Interest Rate
6.56%
Mortgage Type
Credit Line Revolving
Estimated Equity
$608,935
Create a Home Valuation Report for This Property
The Home Valuation Report is an in-depth analysis detailing your home's value as well as a comparison with similar homes in the area
Home Values in the Area
Average Home Value in this Area
Purchase History
| Date | Buyer | Sale Price | Title Company |
|---|---|---|---|
| Morales Elva | $519,000 | Stewart Title Of Ca Inc |
Source: Public Records
Mortgage History
| Date | Status | Borrower | Loan Amount |
|---|---|---|---|
| Open | Morales Elva | $103,800 | |
| Open | Morales Elva | $415,200 |
Source: Public Records
Tax History
| Year | Tax Paid | Tax Assessment Tax Assessment Total Assessment is a certain percentage of the fair market value that is determined by local assessors to be the total taxable value of land and additions on the property. | Land | Improvement |
|---|---|---|---|---|
| 2025 | $6,930 | $636,000 | $414,000 | $222,000 |
| 2024 | $6,930 | $581,000 | $378,000 | $203,000 |
| 2023 | $6,565 | $572,000 | $372,000 | $200,000 |
| 2022 | $6,268 | $547,000 | $356,000 | $191,000 |
| 2021 | $5,281 | $447,000 | $289,000 | $158,000 |
| 2020 | $4,894 | $403,000 | $261,000 | $142,000 |
| 2019 | $4,805 | $400,000 | $259,000 | $141,000 |
| 2018 | $4,457 | $378,000 | $245,000 | $133,000 |
| 2017 | $4,386 | $377,000 | $244,000 | $133,000 |
| 2016 | $3,996 | $354,000 | $229,000 | $125,000 |
| 2015 | $3,390 | $292,000 | $189,000 | $103,000 |
| 2014 | $2,687 | $232,000 | $150,000 | $82,000 |
Source: Public Records
Map
Nearby Homes
- 3631 La Costa Place
- 3638 S B St
- 3151 Fournier St
- 360 Ibsen Place Unit 129
- 140 Gaviota Place Unit 157
- 3130 Paula St
- 4160 Petit Dr Unit 39
- 280 Columbia Place Unit 48
- 320 Columbia Place Unit 46
- 4029 S B St
- 4200 S A St
- 860 Morro Way
- 3820 S J St
- 775 Thayer Ln
- 225 W Iris St
- 1140 Teakwood St
- 2024 S J St
- 4340 Highland Ave
- 505 Pearson Rd
- 4200 Browning Dr
Your Personal Tour Guide
Ask me questions while you tour the home.