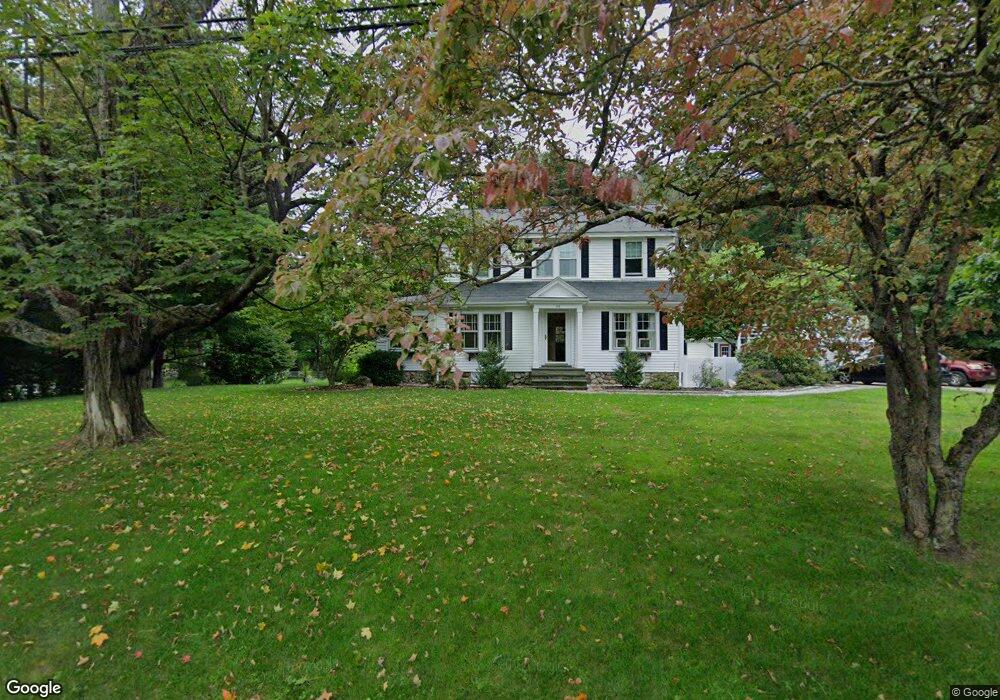
144 Village St Millis, MA 02054
Estimated Value: $682,000 - $740,000
3
Beds
2
Baths
1,944
Sq Ft
$363/Sq Ft
Est. Value
About This Home
This home is located at 144 Village St, Millis, MA 02054 and is currently estimated at $705,980, approximately $363 per square foot. 144 Village St is a home located in Norfolk County with nearby schools including Clyde F Brown, Millis Middle School, and Millis High School.
Ownership History
Date
Name
Owned For
Owner Type
Purchase Details
Closed on
Apr 27, 1998
Sold by
Gallagher Alphonsus
Bought by
Boyle Kevin F and Boyle Virginia M
Current Estimated Value
Home Financials for this Owner
Home Financials are based on the most recent Mortgage that was taken out on this home.
Original Mortgage
$171,000
Outstanding Balance
$33,441
Interest Rate
7.11%
Mortgage Type
Purchase Money Mortgage
Estimated Equity
$672,539
Purchase Details
Closed on
Feb 20, 1998
Sold by
Noon David W and Noon Carole K
Bought by
Gallagher Alphonsus
Create a Home Valuation Report for This Property
The Home Valuation Report is an in-depth analysis detailing your home's value as well as a comparison with similar homes in the area
Home Values in the Area
Average Home Value in this Area
Purchase History
| Date | Buyer | Sale Price | Title Company |
|---|---|---|---|
| Boyle Kevin F | $190,000 | -- | |
| Gallagher Alphonsus | $310,000 | -- |
Source: Public Records
Mortgage History
| Date | Status | Borrower | Loan Amount |
|---|---|---|---|
| Open | Gallagher Alphonsus | $171,000 |
Source: Public Records
Tax History Compared to Growth
Tax History
| Year | Tax Paid | Tax Assessment Tax Assessment Total Assessment is a certain percentage of the fair market value that is determined by local assessors to be the total taxable value of land and additions on the property. | Land | Improvement |
|---|---|---|---|---|
| 2025 | $9,837 | $599,800 | $192,000 | $407,800 |
| 2024 | $9,451 | $575,600 | $192,000 | $383,600 |
| 2023 | $9,418 | $538,500 | $166,900 | $371,600 |
| 2022 | $9,072 | $480,500 | $166,900 | $313,600 |
| 2021 | $8,855 | $451,300 | $166,900 | $284,400 |
| 2020 | $8,666 | $430,300 | $156,000 | $274,300 |
| 2019 | $7,740 | $413,900 | $147,400 | $266,500 |
| 2018 | $7,217 | $400,500 | $134,000 | $266,500 |
| 2017 | $6,954 | $377,500 | $148,000 | $229,500 |
| 2016 | $6,584 | $377,500 | $148,000 | $229,500 |
| 2015 | $6,418 | $377,500 | $148,000 | $229,500 |
Source: Public Records
Map
Nearby Homes