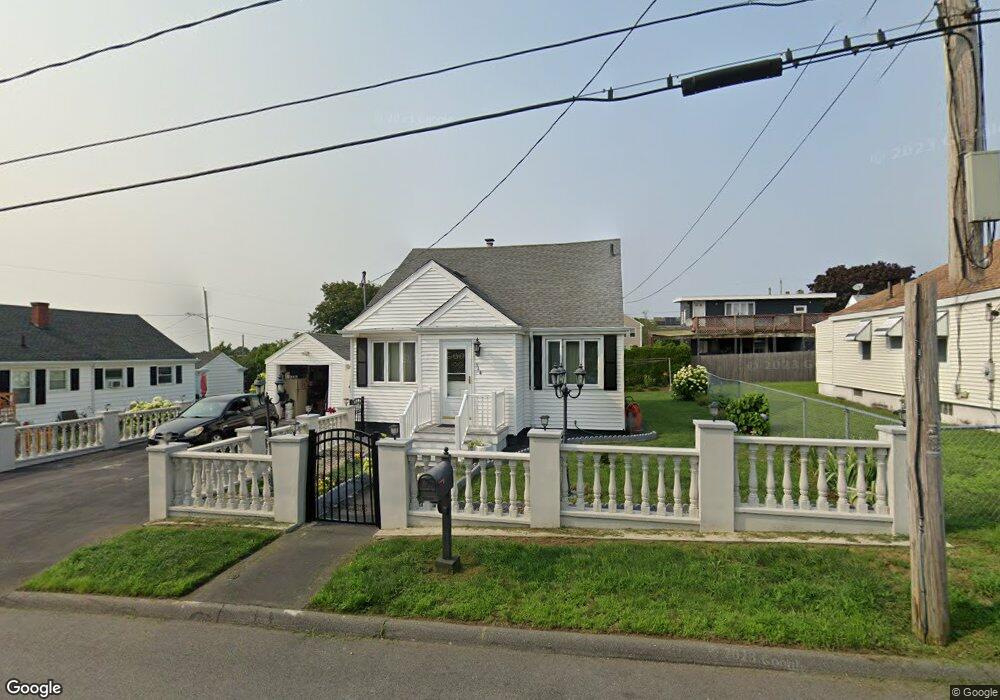
144 Walter St Fall River, MA 02724
Sandy Beach NeighborhoodEstimated Value: $402,000 - $462,000
3
Beds
2
Baths
1,564
Sq Ft
$272/Sq Ft
Est. Value
About This Home
This home is located at 144 Walter St, Fall River, MA 02724 and is currently estimated at $425,145, approximately $271 per square foot. 144 Walter St is a home located in Bristol County with nearby schools including Carlton M. Viveiros Elementary School, Matthew J. Kuss Middle School, and B M C Durfee High School.
Ownership History
Date
Name
Owned For
Owner Type
Purchase Details
Closed on
Sep 28, 2017
Sold by
Dias Alice and Dias Augusto
Bought by
Dias Alice and Dias Augusto C
Current Estimated Value
Purchase Details
Closed on
Sep 29, 1997
Sold by
Pacheco Emanuel R and Pacheco Maria F
Bought by
Dias Augusto and Augusto Alice
Purchase Details
Closed on
Feb 3, 1989
Sold by
Dias Mary M
Bought by
Pacheco Emanuel R
Create a Home Valuation Report for This Property
The Home Valuation Report is an in-depth analysis detailing your home's value as well as a comparison with similar homes in the area
Home Values in the Area
Average Home Value in this Area
Purchase History
| Date | Buyer | Sale Price | Title Company |
|---|---|---|---|
| Dias Alice | -- | -- | |
| Dias Augusto | $116,000 | -- | |
| Pacheco Emanuel R | $118,000 | -- |
Source: Public Records
Mortgage History
| Date | Status | Borrower | Loan Amount |
|---|---|---|---|
| Previous Owner | Pacheco Emanuel R | $67,912 | |
| Previous Owner | Pacheco Emanuel R | $16,500 | |
| Previous Owner | Pacheco Emanuel R | $126,700 |
Source: Public Records
Tax History
| Year | Tax Paid | Tax Assessment Tax Assessment Total Assessment is a certain percentage of the fair market value that is determined by local assessors to be the total taxable value of land and additions on the property. | Land | Improvement |
|---|---|---|---|---|
| 2025 | $3,828 | $334,300 | $116,300 | $218,000 |
| 2024 | $3,647 | $317,400 | $114,100 | $203,300 |
| 2023 | $3,653 | $297,700 | $102,800 | $194,900 |
| 2022 | $3,282 | $260,100 | $97,000 | $163,100 |
| 2021 | $3,062 | $221,400 | $92,600 | $128,800 |
| 2020 | $2,876 | $199,000 | $88,400 | $110,600 |
| 2019 | $2,907 | $199,400 | $92,400 | $107,000 |
| 2018 | $2,823 | $193,100 | $93,100 | $100,000 |
| 2017 | $2,678 | $191,300 | $93,100 | $98,200 |
| 2016 | $2,579 | $189,200 | $95,900 | $93,300 |
| 2015 | $2,475 | $189,200 | $95,900 | $93,300 |
| 2014 | $2,380 | $189,200 | $95,900 | $93,300 |
Source: Public Records
Map
Nearby Homes
- 616 Woodman St
- 126 Wheeler St
- 2229 S Main St
- 609 King Philip St
- 15 Higgins St
- 464 Birch St
- 57 Larouche St
- 1852 S Main St
- 245 Dwelly St
- 1846 S Main St
- 24 Valley St
- 579 Summit St Unit 3
- 579 Summit St Unit 2
- 30 Broad St
- 391 Clarkson St
- 234 Kilburn St
- 917 Dwelly St
- 42 Main Rd
- 20 Wilcox St
- 1334 S Main St
Your Personal Tour Guide
Ask me questions while you tour the home.