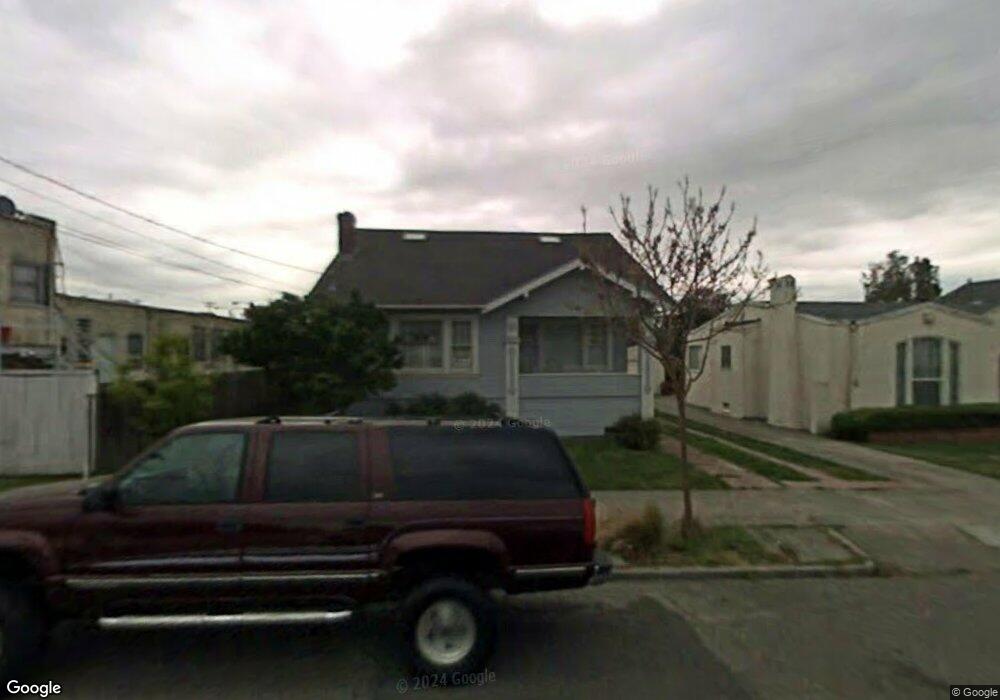
1440 Carleton St Berkeley, CA 94702
West Berkeley NeighborhoodEstimated Value: $1,210,788 - $1,548,000
2
Beds
1
Bath
1,384
Sq Ft
$952/Sq Ft
Est. Value
About This Home
This home is located at 1440 Carleton St, Berkeley, CA 94702 and is currently estimated at $1,317,947, approximately $952 per square foot. 1440 Carleton St is a home located in Alameda County with nearby schools including Malcolm X Elementary School, Washington Elementary School, and Oxford Elementary School.
Ownership History
Date
Name
Owned For
Owner Type
Purchase Details
Closed on
May 21, 2014
Sold by
Kollmeyer Lorna K and Jones David Lee
Bought by
Jones Kollmeyer Family Trust
Current Estimated Value
Purchase Details
Closed on
Apr 15, 1998
Sold by
Boynton Edward M
Bought by
Kollmeyer Lorna
Purchase Details
Closed on
Apr 1, 1994
Sold by
Adams Michael M and Llewelyn Lori Anne
Bought by
Boynton Edward Moor and Kollmeyer Lorna Kathryn
Home Financials for this Owner
Home Financials are based on the most recent Mortgage that was taken out on this home.
Original Mortgage
$146,250
Interest Rate
7.38%
Create a Home Valuation Report for This Property
The Home Valuation Report is an in-depth analysis detailing your home's value as well as a comparison with similar homes in the area
Home Values in the Area
Average Home Value in this Area
Purchase History
| Date | Buyer | Sale Price | Title Company |
|---|---|---|---|
| Jones Kollmeyer Family Trust | -- | None Available | |
| Kollmeyer Lorna K | -- | None Available | |
| Kollmeyer Lorna | -- | -- | |
| Boynton Edward Moor | $195,000 | Old Republic Title Company |
Source: Public Records
Mortgage History
| Date | Status | Borrower | Loan Amount |
|---|---|---|---|
| Previous Owner | Boynton Edward Moor | $146,250 |
Source: Public Records
Tax History
| Year | Tax Paid | Tax Assessment Tax Assessment Total Assessment is a certain percentage of the fair market value that is determined by local assessors to be the total taxable value of land and additions on the property. | Land | Improvement |
|---|---|---|---|---|
| 2025 | $8,002 | $324,421 | $99,426 | $231,995 |
| 2024 | $8,002 | $317,924 | $97,477 | $227,447 |
| 2023 | $7,758 | $318,553 | $95,566 | $222,987 |
| 2022 | $7,724 | $305,307 | $93,692 | $218,615 |
| 2021 | $7,705 | $299,184 | $91,855 | $214,329 |
| 2020 | $7,238 | $303,044 | $90,913 | $212,131 |
| 2019 | $6,872 | $297,103 | $89,131 | $207,972 |
| 2018 | $6,702 | $291,278 | $87,383 | $203,895 |
| 2017 | $6,447 | $285,568 | $85,670 | $199,898 |
| 2016 | $6,151 | $279,970 | $83,991 | $195,979 |
| 2015 | $6,040 | $275,766 | $82,730 | $193,036 |
| 2014 | $5,895 | $270,364 | $81,109 | $189,255 |
Source: Public Records
Map
Nearby Homes
- 1515 Derby St
- 2750 Sacramento St
- 1450 Ward St
- 2758 Sacramento St
- 2774 Sacramento St
- 2782 Sacramento St
- 2790 Sacramento St
- 1516 Blake St
- 1516 Blake St Unit A
- 1524 Blake St
- 2717 Mabel St
- 1612 Parker St
- 1431 Dwight Way
- 2437 Acton St
- 1604 Dwight Way
- 2829 California St
- 1634 Blake St
- 2922 Stanton St
- 1135 Parker St
- 1726 Parker St Unit 2
- 1436 Carleton St
- 2670 Sacramento St
- 1432 Carleton St
- 1512 Carleton St
- 1443 Derby St
- 1439 Derby St
- 1428 Carleton St
- 1435 Derby St
- 1439 Carleton St
- 1422 Carleton St
- 1431 Derby St
- 1427 Carleton St
- 2651 Sacramento St
- 1425 Carleton St
- 1427 Derby St
- 1416 Carleton St
- 1421 Carleton St
- 2624 Sacramento St
- 1504 Carleton St Unit A
- 1504 Carleton St Unit B
Your Personal Tour Guide
Ask me questions while you tour the home.