G
Seller's Agent in 2026
Glenn Knutson
Glenn Knutson Properties
(719) 240-6768
1 in this area
45 Total Sales
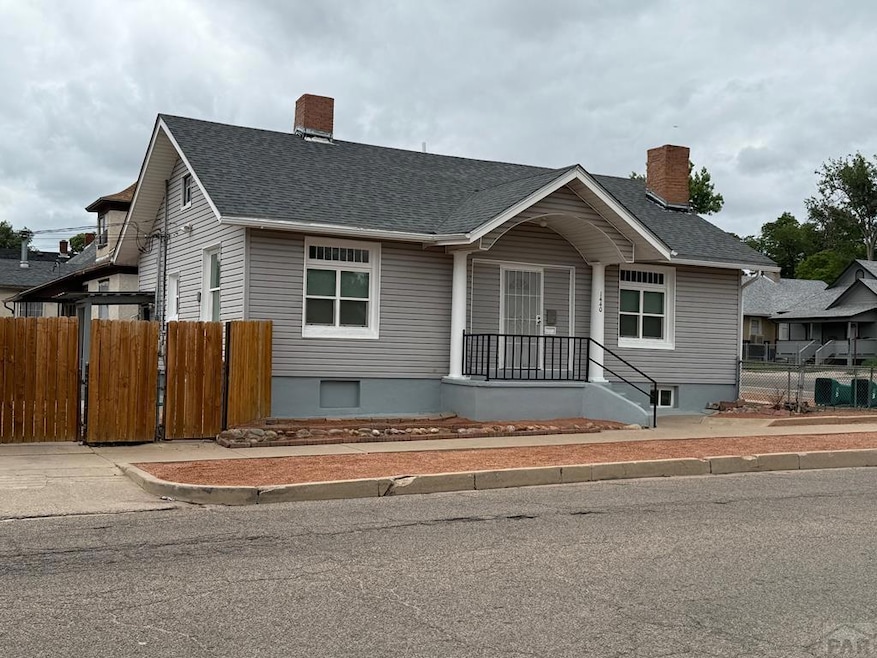
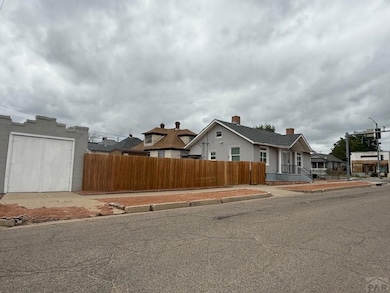
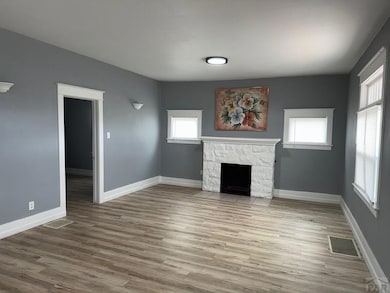

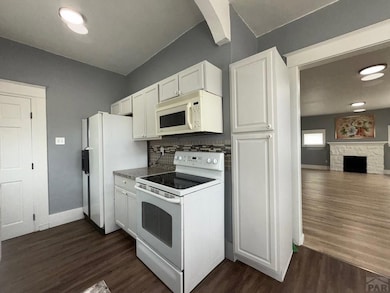
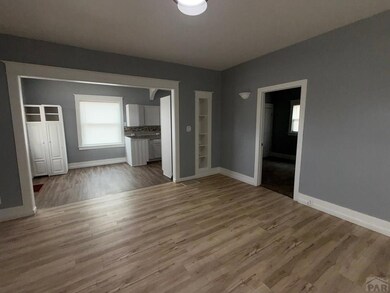
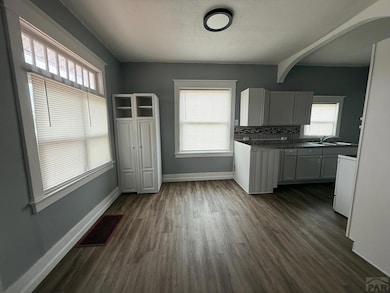
JUST Reduced to $174,900 from $219,900! Seller looking for offers Now! Completely Remodeled rancher with New Sewer Line, Newer Roof, Electrical, Plumbing, Paint, Flooring, Cabinets, Lights, and so Much More! Features 2 Bedrooms, 2 Baths, and a 1 Car Garage with a Newer Shed. Fully Landscaped and Fenced in the Backyard for Privacy. Make your Showing Appointment Now!
Last Agent to Sell the Property
Glenn Knutson Properties Brokerage Phone: 7192406768 License #Sp01314351 Listed on: 06/03/2025
Last Buyer's Agent
Outside Sales Agent Outside Sales Agent
Outside Sales Office
| Date | Type | Sale Price | Title Company |
|---|---|---|---|
| Warranty Deed | $165,000 | Stewart Title | |
| Interfamily Deed Transfer | -- | None Available | |
| Interfamily Deed Transfer | -- | None Available | |
| Quit Claim Deed | -- | None Available | |
| Public Action Common In Florida Clerks Tax Deed Or Tax Deeds Or Property Sold For Taxes | -- | None Available | |
| Personal Reps Deed | $52,000 | None Available | |
| Deed | -- | -- | |
| Deed | -- | -- | |
| Deed | $33,000 | -- | |
| Deed | $12,000 | -- |
| Date | Status | Loan Amount | Loan Type |
|---|---|---|---|
| Open | $148,500 | New Conventional |
| Date | Event | Price | List to Sale | Price per Sq Ft |
|---|---|---|---|---|
| 01/23/2026 01/23/26 | Sold | $165,000 | -5.7% | $151 / Sq Ft |
| 01/07/2026 01/07/26 | Price Changed | $174,900 | -2.8% | $160 / Sq Ft |
| 12/05/2025 12/05/25 | Price Changed | $179,900 | -5.3% | $164 / Sq Ft |
| 11/05/2025 11/05/25 | For Sale | $189,900 | +15.1% | $174 / Sq Ft |
| 10/01/2025 10/01/25 | Off Market | $165,000 | -- | -- |
| 08/29/2025 08/29/25 | Price Changed | $189,900 | -5.0% | $174 / Sq Ft |
| 07/18/2025 07/18/25 | Price Changed | $199,900 | -4.8% | $183 / Sq Ft |
| 07/02/2025 07/02/25 | Price Changed | $209,900 | -2.3% | $192 / Sq Ft |
| 06/16/2025 06/16/25 | Price Changed | $214,900 | -2.3% | $196 / Sq Ft |
| 06/03/2025 06/03/25 | For Sale | $219,900 | -- | $201 / Sq Ft |
| Year | Tax Paid | Tax Assessment Tax Assessment Total Assessment is a certain percentage of the fair market value that is determined by local assessors to be the total taxable value of land and additions on the property. | Land | Improvement |
|---|---|---|---|---|
| 2024 | $751 | $7,620 | -- | -- |
| 2023 | $760 | $11,310 | $1,010 | $10,300 |
| 2022 | $753 | $7,580 | $310 | $7,270 |
| 2021 | $777 | $7,800 | $320 | $7,480 |
| 2020 | $520 | $7,800 | $320 | $7,480 |
| 2019 | $520 | $5,151 | $210 | $4,941 |
| 2018 | $358 | $3,954 | $212 | $3,742 |
| 2017 | $362 | $3,954 | $212 | $3,742 |
| 2016 | $363 | $3,990 | $234 | $3,756 |
| 2015 | $361 | $3,990 | $234 | $3,756 |
| 2014 | $377 | $4,162 | $234 | $3,928 |
G
Seller's Agent in 2026
Glenn Knutson
Glenn Knutson Properties
(719) 240-6768
1 in this area
45 Total Sales
O
Buyer's Agent in 2026
Outside Sales Agent Outside Sales Agent
Outside Sales Office
Source: Pueblo Association of REALTORS®
MLS Number: 232484
APN: 0-4-29-3-33-001
Disclaimer: Certain information contained herein is derived from information provided by parties other than Homes.com. All information provided is deemed reliable, but is not guaranteed to be accurate and should be independently verified.
![]() IDX information is provided exclusively for personal, non-commercial use, and may not be used for any purpose other than to identify prospective properties consumers may be interested in purchasing. Information is deemed reliable but not guaranteed.
IDX information is provided exclusively for personal, non-commercial use, and may not be used for any purpose other than to identify prospective properties consumers may be interested in purchasing. Information is deemed reliable but not guaranteed.
Ask me questions while you tour the home.
