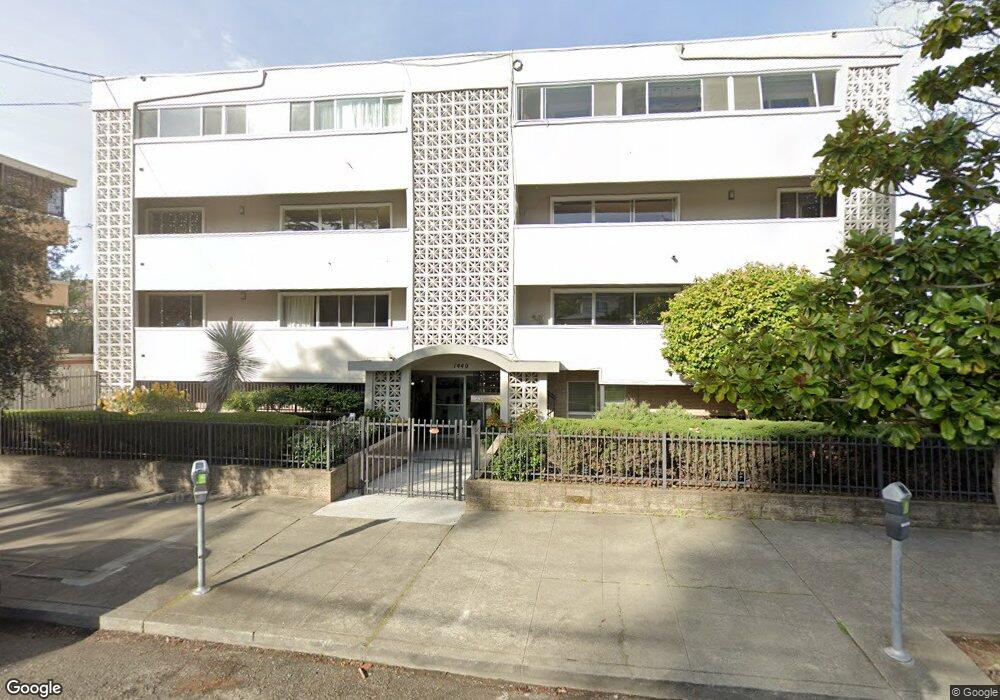
1440 Walnut St Unit 3 Berkeley, CA 94709
North Berkeley NeighborhoodEstimated Value: $916,000 - $1,246,000
2
Beds
2
Baths
1,475
Sq Ft
$699/Sq Ft
Est. Value
About This Home
This home is located at 1440 Walnut St Unit 3, Berkeley, CA 94709 and is currently estimated at $1,031,075, approximately $699 per square foot. 1440 Walnut St Unit 3 is a home located in Alameda County with nearby schools including Berkeley Arts Magnet at Whittier School, Cragmont Elementary School, and Washington Elementary School.
Ownership History
Date
Name
Owned For
Owner Type
Purchase Details
Closed on
Feb 2, 2023
Sold by
Cubberly Robert B
Bought by
Robert B Cubberly 2023 Trust and Cubberly
Current Estimated Value
Purchase Details
Closed on
Jun 10, 2022
Sold by
Cubberly Scott W
Bought by
Cubberly Robert B
Home Financials for this Owner
Home Financials are based on the most recent Mortgage that was taken out on this home.
Original Mortgage
$500,000
Interest Rate
5.63%
Mortgage Type
New Conventional
Purchase Details
Closed on
Nov 7, 2019
Sold by
Cubberly Robert B
Bought by
Cubberly Robert B and Cubberly Scott W
Purchase Details
Closed on
Aug 19, 1997
Sold by
Helen Shivel Carol
Bought by
Shivel Carol H
Purchase Details
Closed on
Mar 28, 1995
Sold by
Viles Mary Peters
Bought by
Shivel Carol Helen
Create a Home Valuation Report for This Property
The Home Valuation Report is an in-depth analysis detailing your home's value as well as a comparison with similar homes in the area
Home Values in the Area
Average Home Value in this Area
Purchase History
| Date | Buyer | Sale Price | Title Company |
|---|---|---|---|
| Robert B Cubberly 2023 Trust | -- | None Listed On Document | |
| Cubberly Robert B | $500,000 | Chicago Title | |
| Cubberly Scott W | -- | Chicago Title | |
| Cubberly Robert B | -- | None Available | |
| Shivel Carol H | -- | -- | |
| Shivel Carol Helen | $179,000 | Placer Title Company |
Source: Public Records
Mortgage History
| Date | Status | Borrower | Loan Amount |
|---|---|---|---|
| Previous Owner | Cubberly Robert B | $500,000 |
Source: Public Records
Tax History
| Year | Tax Paid | Tax Assessment Tax Assessment Total Assessment is a certain percentage of the fair market value that is determined by local assessors to be the total taxable value of land and additions on the property. | Land | Improvement |
|---|---|---|---|---|
| 2025 | $11,351 | $733,984 | $220,195 | $513,789 |
| 2024 | $11,351 | $719,597 | $215,879 | $503,718 |
| 2023 | $11,115 | $705,488 | $211,646 | $493,842 |
| 2022 | $5,859 | $276,311 | $84,993 | $198,318 |
| 2021 | $5,845 | $270,757 | $83,327 | $194,430 |
| 2020 | $5,439 | $274,908 | $82,472 | $192,436 |
| 2019 | $5,122 | $269,520 | $80,856 | $188,664 |
| 2018 | $5,012 | $264,235 | $79,270 | $184,965 |
| 2017 | $4,819 | $259,055 | $77,716 | $181,339 |
| 2016 | $4,591 | $253,977 | $76,193 | $177,784 |
| 2015 | $4,518 | $250,162 | $75,048 | $175,114 |
| 2014 | $4,460 | $245,263 | $73,579 | $171,684 |
Source: Public Records
Map
Nearby Homes
- 1440 Walnut St Unit 5
- 1444 Walnut St
- 1412 Oxford St
- 1408 Henry St
- 1519 Oxford St Unit E
- 1425 Martin Luther King jr Way
- 1471 Scenic Ave
- 1610 Milvia St
- 2121 Eunice St
- 1682 Oxford St
- 1609 Bonita Ave Unit 5
- 2201 Virginia St Unit 2
- 1622 Scenic Ave
- 1815 Vine St
- 1625 Martin Luther King jr Way
- 2315 Eunice St
- 2365 Virginia St Unit 2
- 2340 Virginia St
- 1739 Spruce St
- 1950 Hopkins St
- 1440 Walnut St Unit 8
- 1440 Walnut St Unit A
- 1440 Walnut St Unit 7
- 1440 Walnut St Unit 6
- 1440 Walnut St Unit 2
- 1440 Walnut St Unit 4
- 1440 Walnut St Unit 1
- 1440 Walnut St
- 1440 Walnut St
- 1440 Walnut St
- 1411 Walnut St
- 1419 Walnut St
- 1423 Walnut St Unit 3
- 1423 Walnut St
- 1423 Walnut St
- 1423 Walnut St
- 1423 Walnut St
- 1423 Walnut St Unit 1
- 1409 Walnut St
- 1425 Walnut St
Your Personal Tour Guide
Ask me questions while you tour the home.