Estimated Value: $552,000 - $739,000
4
Beds
3
Baths
2,756
Sq Ft
$222/Sq Ft
Est. Value
About This Home
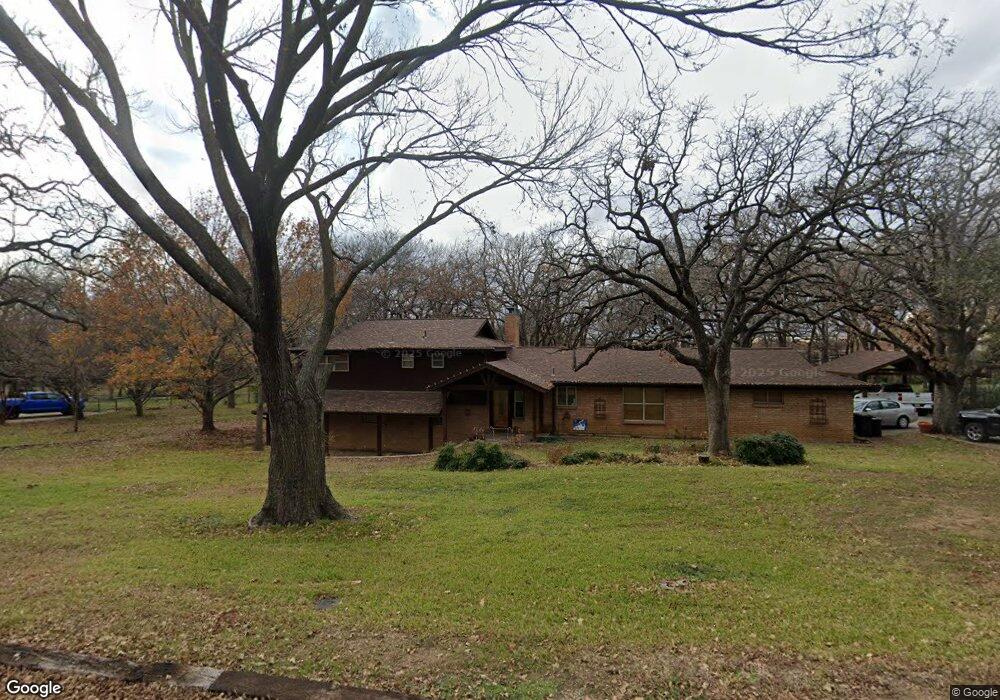
This home is located at 1441 Cimarron Trail, Hurst, TX 76053 and is currently estimated at $610,696, approximately $221 per square foot. 1441 Cimarron Trail is a home located in Tarrant County with nearby schools including Shady Oaks Elementary School, Bedford Junior High School, and L.D. Bell High School.
Ownership History
Date
Name
Owned For
Owner Type
Purchase Details
Closed on
Sep 16, 2016
Sold by
Lewis Dan C and Lewis Debra A
Bought by
Tucker Jason and Tucker Dara
Current Estimated Value
Home Financials for this Owner
Home Financials are based on the most recent Mortgage that was taken out on this home.
Original Mortgage
$243,750
Outstanding Balance
$154,295
Interest Rate
3.43%
Mortgage Type
New Conventional
Estimated Equity
$456,401
Purchase Details
Closed on
Jul 16, 1997
Sold by
Wild Melvin and Wild Jennie
Bought by
Lewis Dan C and Lewis Debra A
Home Financials for this Owner
Home Financials are based on the most recent Mortgage that was taken out on this home.
Original Mortgage
$126,250
Interest Rate
7.85%
Purchase Details
Closed on
Jan 5, 1995
Sold by
C & M Properties Partnership
Bought by
Wild Melvin Gilbert and Wild Jennie Elizabeth
Create a Home Valuation Report for This Property
The Home Valuation Report is an in-depth analysis detailing your home's value as well as a comparison with similar homes in the area
Home Values in the Area
Average Home Value in this Area
Purchase History
| Date | Buyer | Sale Price | Title Company |
|---|---|---|---|
| Tucker Jason | -- | Freedom Title Company | |
| Lewis Dan C | -- | Fidelity National Title Agen | |
| Wild Melvin Gilbert | -- | Trinity Western Title Co |
Source: Public Records
Mortgage History
| Date | Status | Borrower | Loan Amount |
|---|---|---|---|
| Open | Tucker Jason | $243,750 | |
| Previous Owner | Lewis Dan C | $126,250 |
Source: Public Records
Tax History Compared to Growth
Tax History
| Year | Tax Paid | Tax Assessment Tax Assessment Total Assessment is a certain percentage of the fair market value that is determined by local assessors to be the total taxable value of land and additions on the property. | Land | Improvement |
|---|---|---|---|---|
| 2025 | $6,116 | $494,887 | $107,652 | $387,235 |
| 2024 | $6,116 | $494,887 | $107,652 | $387,235 |
| 2023 | $7,027 | $541,947 | $126,650 | $415,297 |
| 2022 | $7,342 | $356,970 | $126,650 | $230,320 |
| 2021 | $6,991 | $289,879 | $126,650 | $163,229 |
| 2020 | $7,652 | $332,444 | $126,650 | $205,794 |
| 2019 | $7,077 | $324,678 | $126,650 | $198,028 |
| 2018 | $5,747 | $262,867 | $56,992 | $205,875 |
| 2017 | $6,677 | $263,849 | $67,050 | $196,799 |
| 2016 | $5,127 | $261,588 | $67,050 | $194,538 |
| 2015 | $4,332 | $184,200 | $67,050 | $117,150 |
| 2014 | $4,332 | $184,200 | $67,050 | $117,150 |
Source: Public Records
Map
Nearby Homes
- 521 Brookview Dr
- 608 W Pleasantview Dr
- 425 W Pleasantview Dr
- 813 Overhill Ct
- 1625 Oak Creek Dr
- 1208 Birch St
- 1208 Karla Dr
- 1145 Terrace Trail
- 520 Baker Dr
- 409 Vicki Place
- 1204 Princess Ln
- 229 Brookview Dr
- 823 W Harwood Rd
- 420 Bedford Ct W
- 713 Edgehill Dr
- 1337 Harrison Ln
- 440 W Louella Dr
- 853 Royal Terrace
- 820 Bedford Ct W
- 1352 Simpson Dr
- 1443 Cimarron Trail
- 1440 Cimarron Trail
- 1405 Cimarron Trail
- 1442 Cimarron Trail
- 1445 Cimarron Trail
- 1444 Cimarron Trail
- 1448 Cimarron Trail
- 1401 Cimarron Trail
- 1402 Cimarron Trail
- 1400 Cimarron Trail
- 1400 Cimarron Trail
- 1453 Cimarron Trail
- 1452 Cimarron Trail
- 1421 Brookside Dr
- 1417 Brookside Dr
- 1425 Brookside Dr
- 1413 Brookside Dr
- 1429 Brookside Dr
- 669 Airport Fwy Unit 300
- 669 Airport Fwy Unit 209