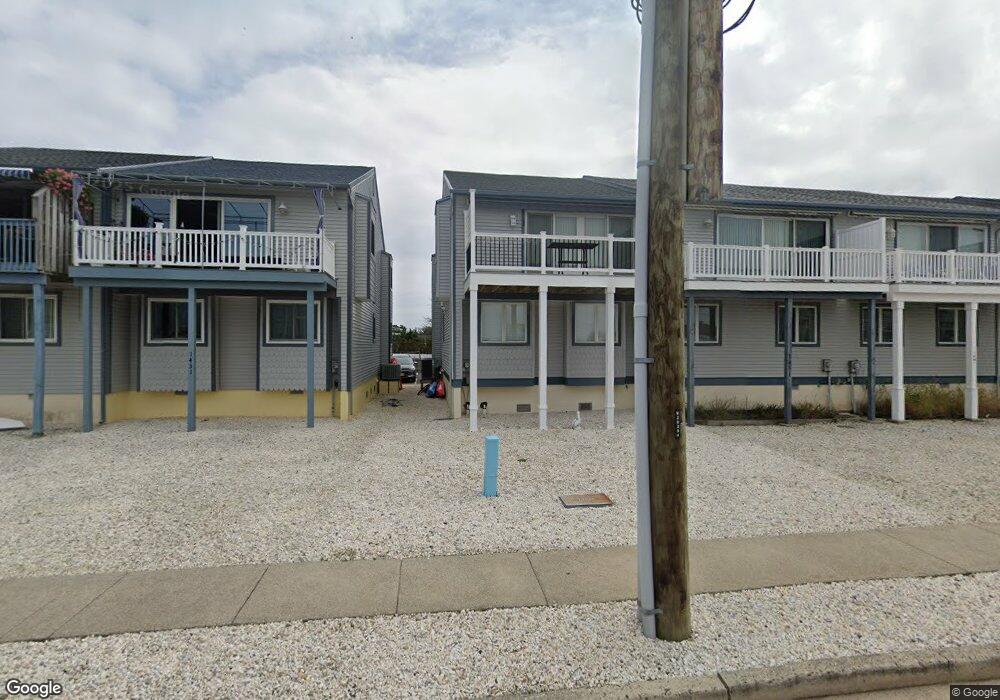
1441 Ocean Dr Avalon, NJ 08202
Estimated Value: $1,769,000 - $2,494,000
--
Bed
--
Bath
1,615
Sq Ft
$1,253/Sq Ft
Est. Value
About This Home
This home is located at 1441 Ocean Dr, Avalon, NJ 08202 and is currently estimated at $2,024,333, approximately $1,253 per square foot. 1441 Ocean Dr is a home located in Cape May County with nearby schools including Avalon Elementary School.
Ownership History
Date
Name
Owned For
Owner Type
Purchase Details
Closed on
Jul 30, 2005
Sold by
Pettit Joanne C
Bought by
Lamastra Carl A and Lamastra Rebecca E
Current Estimated Value
Home Financials for this Owner
Home Financials are based on the most recent Mortgage that was taken out on this home.
Original Mortgage
$250,000
Outstanding Balance
$142,746
Interest Rate
7.04%
Mortgage Type
Fannie Mae Freddie Mac
Estimated Equity
$1,881,587
Purchase Details
Closed on
Aug 3, 1991
Sold by
Brant Alan R and Brant Patricia G
Bought by
Pettit Albert W and Pettit Joann C
Create a Home Valuation Report for This Property
The Home Valuation Report is an in-depth analysis detailing your home's value as well as a comparison with similar homes in the area
Home Values in the Area
Average Home Value in this Area
Purchase History
| Date | Buyer | Sale Price | Title Company |
|---|---|---|---|
| Lamastra Carl A | $788,000 | Title Alliance Of Cape May C | |
| Pettit Albert W | $176,500 | -- |
Source: Public Records
Mortgage History
| Date | Status | Borrower | Loan Amount |
|---|---|---|---|
| Open | Lamastra Carl A | $250,000 |
Source: Public Records
Tax History Compared to Growth
Tax History
| Year | Tax Paid | Tax Assessment Tax Assessment Total Assessment is a certain percentage of the fair market value that is determined by local assessors to be the total taxable value of land and additions on the property. | Land | Improvement |
|---|---|---|---|---|
| 2025 | $3,710 | $604,200 | $412,500 | $191,700 |
| 2024 | $3,710 | $604,200 | $412,500 | $191,700 |
| 2023 | $3,680 | $604,200 | $412,500 | $191,700 |
| 2022 | $3,432 | $604,200 | $412,500 | $191,700 |
| 2021 | $3,305 | $604,200 | $412,500 | $191,700 |
| 2020 | $3,178 | $604,200 | $412,500 | $191,700 |
| 2019 | $3,081 | $604,200 | $412,500 | $191,700 |
| 2018 | $2,949 | $604,200 | $412,500 | $191,700 |
| 2017 | $3,475 | $625,000 | $444,900 | $180,100 |
| 2016 | $3,438 | $625,000 | $444,900 | $180,100 |
| 2015 | $3,381 | $625,000 | $444,900 | $180,100 |
| 2014 | $3,344 | $625,000 | $444,900 | $180,100 |
Source: Public Records
Map
Nearby Homes