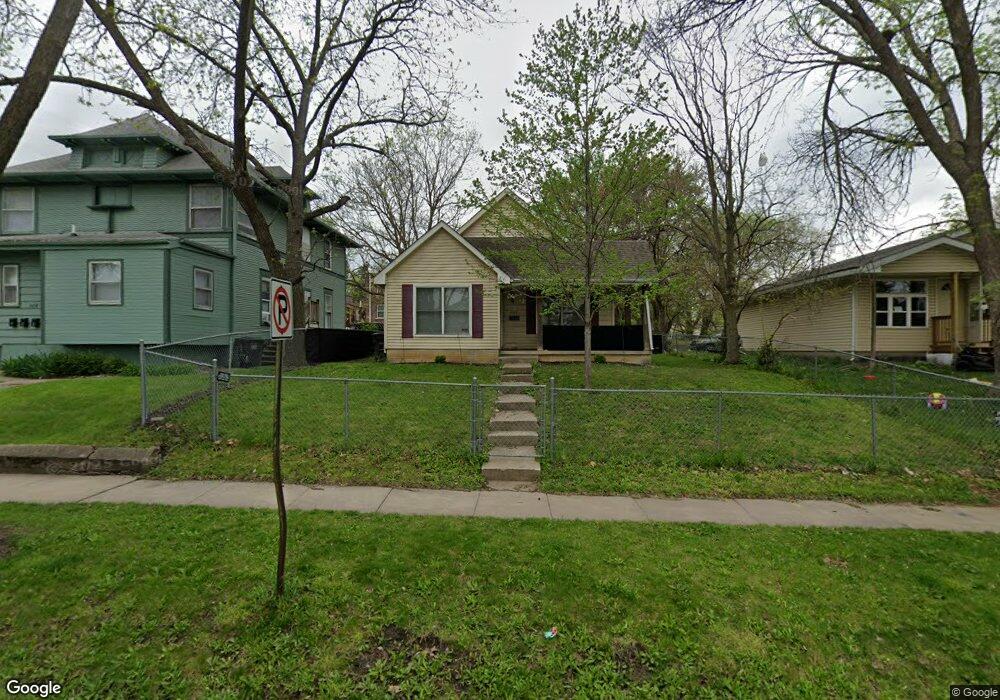
1442 9th St Des Moines, IA 50314
River Bend NeighborhoodEstimated Value: $119,000 - $158,000
3
Beds
1
Bath
1,046
Sq Ft
$138/Sq Ft
Est. Value
About This Home
This home is located at 1442 9th St, Des Moines, IA 50314 and is currently estimated at $144,810, approximately $138 per square foot. 1442 9th St is a home located in Polk County with nearby schools including Moulton Elementary School, Harding Middle School, and North High School.
Ownership History
Date
Name
Owned For
Owner Type
Purchase Details
Closed on
Dec 13, 2006
Sold by
Greater Des Moines Habitat For Humanity
Bought by
Bradford Shirl Lynn
Current Estimated Value
Home Financials for this Owner
Home Financials are based on the most recent Mortgage that was taken out on this home.
Original Mortgage
$69,608
Outstanding Balance
$6,893
Interest Rate
6.33%
Mortgage Type
Seller Take Back
Estimated Equity
$137,917
Purchase Details
Closed on
Jul 10, 2006
Sold by
City Of Des Moines Municipal Hsng Agency
Bought by
Greater Des Moines Habitat Humanity Inc
Create a Home Valuation Report for This Property
The Home Valuation Report is an in-depth analysis detailing your home's value as well as a comparison with similar homes in the area
Home Values in the Area
Average Home Value in this Area
Purchase History
| Date | Buyer | Sale Price | Title Company |
|---|---|---|---|
| Bradford Shirl Lynn | $69,500 | None Available | |
| Greater Des Moines Habitat Humanity Inc | $67,500 | None Available |
Source: Public Records
Mortgage History
| Date | Status | Borrower | Loan Amount |
|---|---|---|---|
| Open | Bradford Shirl Lynn | $69,608 |
Source: Public Records
Tax History
| Year | Tax Paid | Tax Assessment Tax Assessment Total Assessment is a certain percentage of the fair market value that is determined by local assessors to be the total taxable value of land and additions on the property. | Land | Improvement |
|---|---|---|---|---|
| 2025 | $1,938 | $113,800 | $13,600 | $100,200 |
| 2024 | $1,938 | $98,500 | $11,600 | $86,900 |
| 2023 | $1,730 | $98,500 | $11,600 | $86,900 |
| 2022 | $1,716 | $73,400 | $8,800 | $64,600 |
| 2021 | $1,650 | $73,400 | $8,800 | $64,600 |
| 2020 | $1,714 | $66,100 | $7,800 | $58,300 |
| 2019 | $1,624 | $66,100 | $7,800 | $58,300 |
| 2018 | $1,606 | $60,400 | $7,000 | $53,400 |
| 2017 | $1,658 | $60,400 | $7,000 | $53,400 |
| 2016 | $1,614 | $61,400 | $7,000 | $54,400 |
| 2015 | $1,614 | $61,400 | $7,000 | $54,400 |
| 2014 | $1,444 | $56,400 | $7,000 | $49,400 |
Source: Public Records
Map
Nearby Homes
Your Personal Tour Guide
Ask me questions while you tour the home.