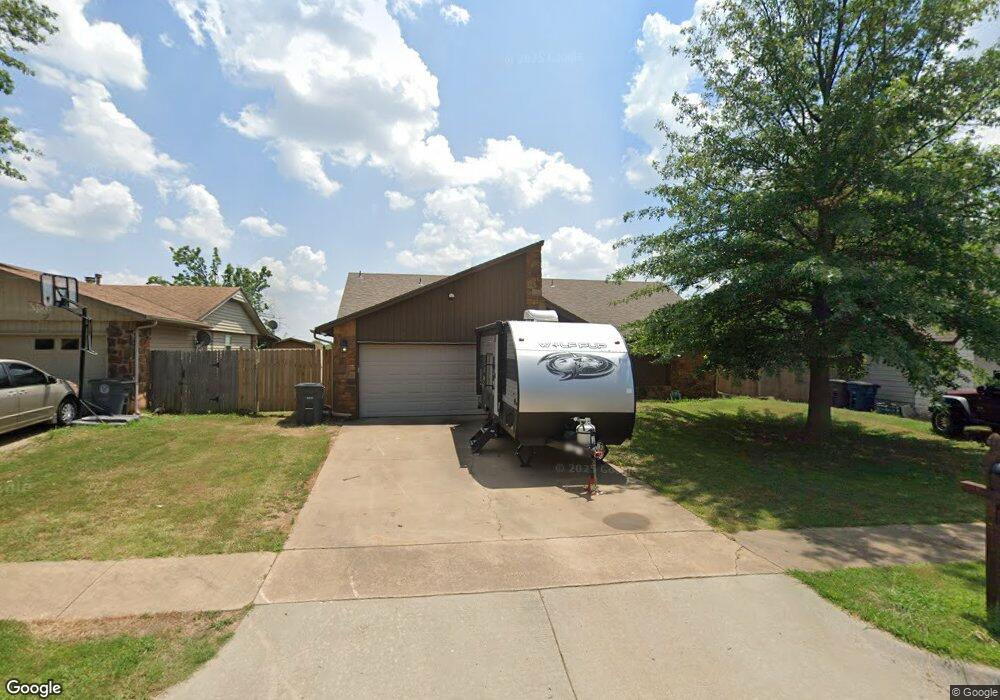
14424 E 38th St Tulsa, OK 74134
Park Plaza East NeighborhoodEstimated Value: $211,614 - $239,000
3
Beds
2
Baths
1,740
Sq Ft
$131/Sq Ft
Est. Value
About This Home
This home is located at 14424 E 38th St, Tulsa, OK 74134 and is currently estimated at $227,904, approximately $130 per square foot. 14424 E 38th St is a home located in Tulsa County with nearby schools including Boevers Elementary School, Union 8th Grade Center, and Union 6th-7th Grade Center.
Ownership History
Date
Name
Owned For
Owner Type
Purchase Details
Closed on
Feb 14, 2017
Sold by
Anderson Barbara R and Stroup Patrick E
Bought by
Anderson Barbara R
Current Estimated Value
Purchase Details
Closed on
Oct 13, 2016
Sold by
Anderson Stephen Wayne and Anderson Stacey
Bought by
Anderson Barbara R and Stroup Patrick E
Purchase Details
Closed on
Jun 21, 2002
Sold by
Davis Rebecca L and Davis Rickey Lee
Bought by
Anderson Stephen W and Anderson Barbara R
Home Financials for this Owner
Home Financials are based on the most recent Mortgage that was taken out on this home.
Original Mortgage
$104,176
Outstanding Balance
$43,093
Interest Rate
6.78%
Mortgage Type
FHA
Estimated Equity
$184,811
Purchase Details
Closed on
Nov 22, 1999
Sold by
Roche Michael L and Roche Nita J
Bought by
Smith Rebecca L and Smith Patricia Ann
Purchase Details
Closed on
Aug 22, 1997
Sold by
Wilcox David L and Wilcox Linda L
Bought by
Roche Michael L and Roche Nita J
Create a Home Valuation Report for This Property
The Home Valuation Report is an in-depth analysis detailing your home's value as well as a comparison with similar homes in the area
Home Values in the Area
Average Home Value in this Area
Purchase History
| Date | Buyer | Sale Price | Title Company |
|---|---|---|---|
| Anderson Barbara R | -- | Tulsa Abstract And Title Co | |
| Anderson Barbara R | -- | Tulsa Abstract And Title Co | |
| Anderson Stephen W | $105,000 | Utica Title & Escrow | |
| Smith Rebecca L | $94,000 | First American Title & Abs C | |
| Roche Michael L | $85,000 | First Amer Title & Abstract |
Source: Public Records
Mortgage History
| Date | Status | Borrower | Loan Amount |
|---|---|---|---|
| Open | Anderson Stephen W | $104,176 |
Source: Public Records
Tax History
| Year | Tax Paid | Tax Assessment Tax Assessment Total Assessment is a certain percentage of the fair market value that is determined by local assessors to be the total taxable value of land and additions on the property. | Land | Improvement |
|---|---|---|---|---|
| 2025 | $2,057 | $15,045 | $1,699 | $13,346 |
| 2024 | $1,806 | $14,579 | $2,038 | $12,541 |
| 2023 | $1,806 | $15,125 | $2,193 | $12,932 |
| 2022 | $1,823 | $13,684 | $2,483 | $11,201 |
| 2021 | $1,789 | $13,257 | $2,406 | $10,851 |
| 2020 | $1,708 | $12,841 | $2,403 | $10,438 |
| 2019 | $1,712 | $12,438 | $2,328 | $10,110 |
| 2018 | $1,655 | $12,047 | $2,255 | $9,792 |
| 2017 | $1,612 | $12,667 | $2,371 | $10,296 |
| 2016 | $1,526 | $12,298 | $2,640 | $9,658 |
| 2015 | $1,543 | $12,298 | $2,640 | $9,658 |
| 2014 | $1,519 | $12,298 | $2,640 | $9,658 |
Source: Public Records
Map
Nearby Homes
- 3804 S 146th East Ave E
- 14215 E 37th Place
- 14209 E 37th Place
- 14810 E 37th St
- 3356 S 142nd East Ave
- 3969 S 152nd East Ave
- 4928 N Walnut Ave
- 5010 N Walnut Ave
- 3727 S 151st East Ave
- 3460 S 149th East Ave
- 4916 N Walnut Ave
- 4904 N Walnut Ave
- 4924 N Walnut Ave
- 4932 N Walnut Ave
- 4912 N Walnut Ave
- 13432 E 36th St
- 5003 N Walnut Place
- 4915 N Walnut Place
- 4915 N Walnut Ave
- 5003 N Walnut Ave
- 14428 E 38th St
- 14420 E 38th St
- 14432 E 38th St
- 14425 E 38th St
- 14419 E 38th St
- 14412 E 38th St
- 14436 E 38th St
- 14413 E 38th St
- 3737 S 144th East Place
- 3809 S 144th East Ave
- 14407 E 38th St
- 3733 S 144th Place E
- 3733 S 144th East Place
- 14274 E 37th Place
- 14270 E 37th Place
- 14403 E 38th St
- 3727 S 144th East Place
- 14266 E 37th Place
- 3810 S 144th East Ave
- 3723 S 144th East Place
Your Personal Tour Guide
Ask me questions while you tour the home.