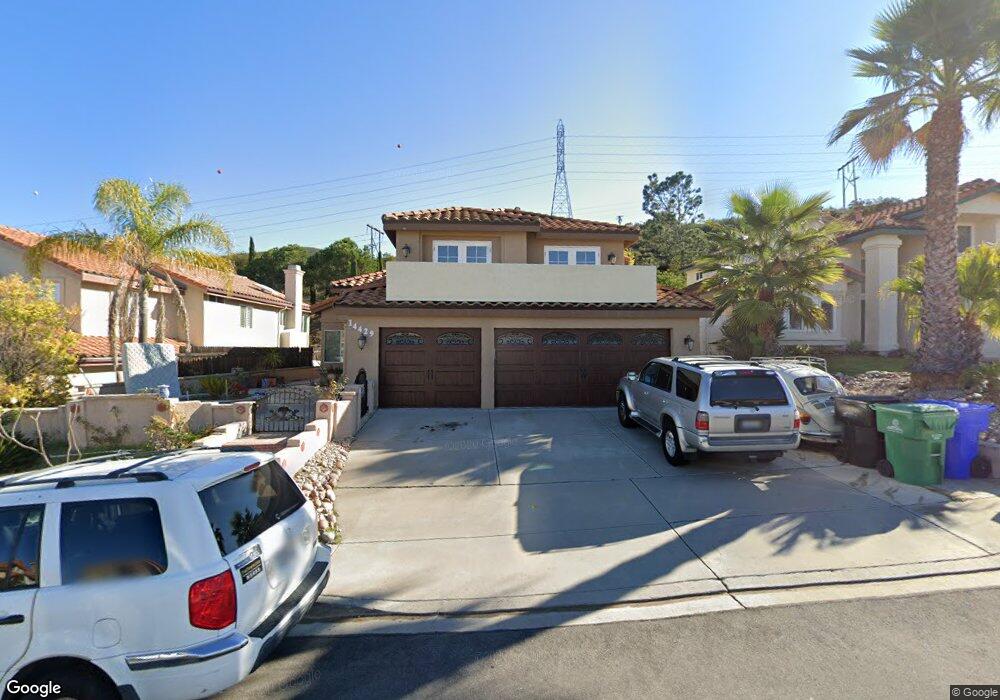
14429 Corte Lampara San Diego, CA 92129
Rancho Peñasquitos NeighborhoodEstimated Value: $1,548,589 - $1,660,000
5
Beds
3
Baths
2,546
Sq Ft
$633/Sq Ft
Est. Value
About This Home
This home is located at 14429 Corte Lampara, San Diego, CA 92129 and is currently estimated at $1,611,147, approximately $632 per square foot. 14429 Corte Lampara is a home located in San Diego County with nearby schools including Adobe Bluffs Elementary School, Black Mountain Middle School, and Mt. Carmel High School.
Ownership History
Date
Name
Owned For
Owner Type
Purchase Details
Closed on
Mar 20, 2024
Sold by
Nguyen Lam Quy and Ha Thi
Bought by
Nguyen Family Living Trust and Nguyen
Current Estimated Value
Purchase Details
Closed on
Feb 14, 1996
Sold by
Nguyen Lam and Nguyen Ha Thi Ngoc
Bought by
Nguyen Lam Quy and Nguyen Ha Thi Ngoc
Home Financials for this Owner
Home Financials are based on the most recent Mortgage that was taken out on this home.
Original Mortgage
$184,000
Interest Rate
6.55%
Purchase Details
Closed on
Feb 22, 1994
Sold by
Nguyen Lam and Nguyen Ha Thi Ngoc
Bought by
Nguyen Lam and Nguyen Ha Thi Ngoc
Purchase Details
Closed on
Apr 15, 1988
Create a Home Valuation Report for This Property
The Home Valuation Report is an in-depth analysis detailing your home's value as well as a comparison with similar homes in the area
Home Values in the Area
Average Home Value in this Area
Purchase History
| Date | Buyer | Sale Price | Title Company |
|---|---|---|---|
| Nguyen Family Living Trust | -- | None Listed On Document | |
| Nguyen Lam Quy | -- | Fidelity National Title | |
| Nguyen Lam | -- | -- | |
| -- | $195,000 | -- |
Source: Public Records
Mortgage History
| Date | Status | Borrower | Loan Amount |
|---|---|---|---|
| Previous Owner | Nguyen Lam Quy | $184,000 |
Source: Public Records
Tax History Compared to Growth
Tax History
| Year | Tax Paid | Tax Assessment Tax Assessment Total Assessment is a certain percentage of the fair market value that is determined by local assessors to be the total taxable value of land and additions on the property. | Land | Improvement |
|---|---|---|---|---|
| 2025 | $4,292 | $390,658 | $150,534 | $240,124 |
| 2024 | $4,292 | $382,999 | $147,583 | $235,416 |
| 2023 | $4,198 | $375,490 | $144,690 | $230,800 |
| 2022 | $4,125 | $368,128 | $141,853 | $226,275 |
| 2021 | $4,069 | $360,911 | $139,072 | $221,839 |
| 2020 | $4,014 | $357,211 | $137,646 | $219,565 |
| 2019 | $3,908 | $350,208 | $134,948 | $215,260 |
| 2018 | $3,797 | $343,342 | $132,302 | $211,040 |
| 2017 | $3,694 | $336,610 | $129,708 | $206,902 |
| 2016 | $3,616 | $330,011 | $127,165 | $202,846 |
| 2015 | $3,561 | $325,055 | $125,255 | $199,800 |
| 2014 | $3,476 | $318,689 | $122,802 | $195,887 |
Source: Public Records
Map
Nearby Homes
- 14442 Calle Nublado
- 9120 Meadowrun Place
- 9360 Stargaze Ave
- 9151 Emden Rd
- 13907 Bruyere Ct
- 8862 La Cartera St
- 14305 El Vestido St
- 8183 Doug Hill
- 8114 Sendero de La Pradera
- 8730 Twin Trails Dr
- 13879 Paseo Cardiel
- 13856 Paseo Cardiel
- 9959 Riverhead Dr
- 13837 Paseo Cardiel
- 9858 Via Caceres
- 13559 Chaco Ct
- 9555 Via Pereza
- 7795 Sendero Angelica
- 13445 Appalachian Way
- 13640 Via Cima Bella
- 14435 Corte Lampara
- 14423 Corte Lampara
- 14441 Corte Lampara
- 14417 Corte Lampara
- 14447 Corte Lampara
- 14411 Corte Lampara
- 14453 Corte Lampara
- 14434 Corte Lampara
- 14428 Corte Lampara
- 14405 Corte Lampara
- 14440 Corte Lampara
- 14422 Corte Lampara
- 14404 Corte Lampara
- 14416 Corte Lampara
- 14446 Corte Lampara
- 14461 Corte Lampara
- 14452 Corte Lampara
- 14469 Corte Lampara
- 14460 Corte Lampara
- 14388 Marianopolis Way