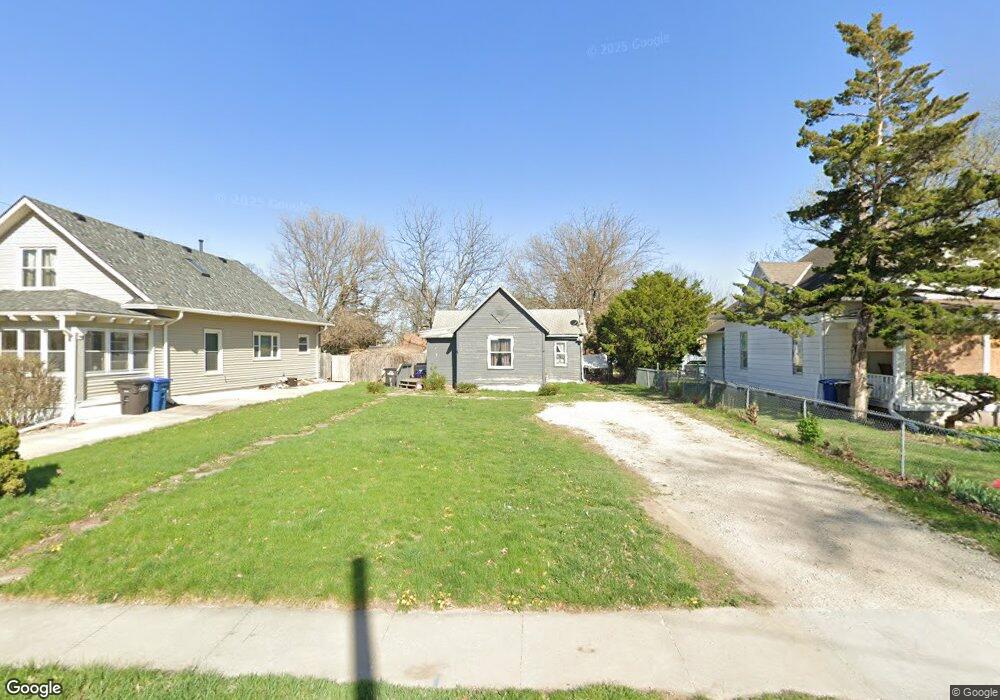
1443 31st St Des Moines, IA 50311
Drake NeighborhoodEstimated Value: $123,000 - $157,860
1
Bed
1
Bath
858
Sq Ft
$162/Sq Ft
Est. Value
About This Home
This home is located at 1443 31st St, Des Moines, IA 50311 and is currently estimated at $138,715, approximately $161 per square foot. 1443 31st St is a home located in Polk County with nearby schools including Perkins Elementary School and Roosevelt High School.
Ownership History
Date
Name
Owned For
Owner Type
Purchase Details
Closed on
Apr 23, 2016
Sold by
Tapps Kayla
Bought by
Thompson Joseph
Current Estimated Value
Purchase Details
Closed on
Oct 23, 2009
Sold by
Johnson Carol
Bought by
Frisbie Brian
Home Financials for this Owner
Home Financials are based on the most recent Mortgage that was taken out on this home.
Original Mortgage
$69,900
Interest Rate
5.1%
Mortgage Type
Seller Take Back
Purchase Details
Closed on
May 12, 2004
Sold by
Olson Carol and Olson David
Bought by
Johnson Carol
Create a Home Valuation Report for This Property
The Home Valuation Report is an in-depth analysis detailing your home's value as well as a comparison with similar homes in the area
Home Values in the Area
Average Home Value in this Area
Purchase History
| Date | Buyer | Sale Price | Title Company |
|---|---|---|---|
| Thompson Joseph | -- | None Available | |
| Frisbie Brian | $69,900 | None Available | |
| Johnson Carol | -- | -- |
Source: Public Records
Mortgage History
| Date | Status | Borrower | Loan Amount |
|---|---|---|---|
| Previous Owner | Frisbie Brian | $69,900 |
Source: Public Records
Tax History Compared to Growth
Tax History
| Year | Tax Paid | Tax Assessment Tax Assessment Total Assessment is a certain percentage of the fair market value that is determined by local assessors to be the total taxable value of land and additions on the property. | Land | Improvement |
|---|---|---|---|---|
| 2025 | $2,342 | $131,500 | $29,600 | $101,900 |
| 2024 | $2,342 | $119,000 | $26,700 | $92,300 |
| 2023 | $2,262 | $119,000 | $26,700 | $92,300 |
| 2022 | $2,246 | $96,000 | $21,900 | $74,100 |
| 2021 | $2,114 | $96,000 | $21,900 | $74,100 |
| 2020 | $2,196 | $84,700 | $19,500 | $65,200 |
| 2019 | $2,078 | $84,700 | $19,500 | $65,200 |
| 2018 | $2,222 | $77,300 | $17,500 | $59,800 |
| 2017 | $1,942 | $77,300 | $17,500 | $59,800 |
| 2016 | $1,892 | $71,800 | $16,200 | $55,600 |
| 2015 | $1,892 | $71,800 | $16,200 | $55,600 |
| 2014 | $2,114 | $66,100 | $14,900 | $51,200 |
Source: Public Records
Map
Nearby Homes