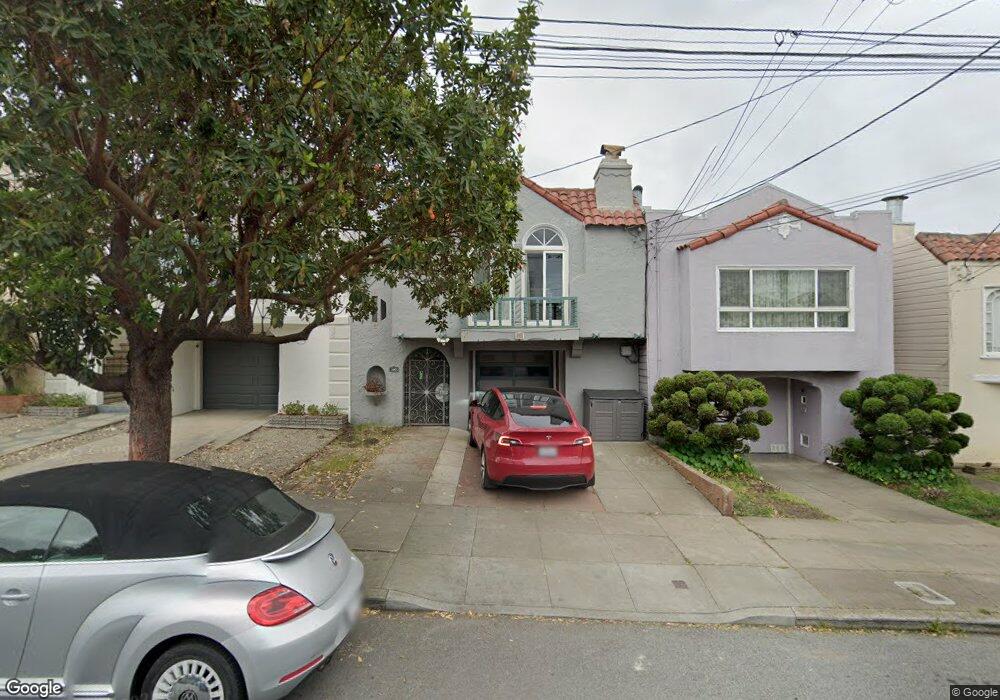
1443 32nd Ave San Francisco, CA 94122
Central Sunset NeighborhoodEstimated Value: $1,574,000 - $1,921,303
4
Beds
3
Baths
2,085
Sq Ft
$824/Sq Ft
Est. Value
About This Home
This home is located at 1443 32nd Ave, San Francisco, CA 94122 and is currently estimated at $1,717,076, approximately $823 per square foot. 1443 32nd Ave is a home located in San Francisco County with nearby schools including Stevenson (Robert Louis) Elementary School, Giannini (A.P.) Middle School, and Cornerstone Academy-Lawton Campus.
Ownership History
Date
Name
Owned For
Owner Type
Purchase Details
Closed on
Jul 2, 2018
Sold by
Kam Wilson C and Kam May Chow
Bought by
Kam Samson Man Hang and Wong Jerry Sai Kit
Current Estimated Value
Home Financials for this Owner
Home Financials are based on the most recent Mortgage that was taken out on this home.
Original Mortgage
$700,000
Outstanding Balance
$606,655
Interest Rate
4.5%
Mortgage Type
New Conventional
Estimated Equity
$1,110,421
Purchase Details
Closed on
Mar 27, 1998
Sold by
Kam Wilson C and Chow May
Bought by
Kam Wilson C and Kam May Chow
Create a Home Valuation Report for This Property
The Home Valuation Report is an in-depth analysis detailing your home's value as well as a comparison with similar homes in the area
Home Values in the Area
Average Home Value in this Area
Purchase History
| Date | Buyer | Sale Price | Title Company |
|---|---|---|---|
| Kam Samson Man Hang | $1,000,000 | Fidelity Title Co Concord | |
| Kam Wilson C | -- | -- |
Source: Public Records
Mortgage History
| Date | Status | Borrower | Loan Amount |
|---|---|---|---|
| Open | Kam Samson Man Hang | $700,000 |
Source: Public Records
Tax History Compared to Growth
Tax History
| Year | Tax Paid | Tax Assessment Tax Assessment Total Assessment is a certain percentage of the fair market value that is determined by local assessors to be the total taxable value of land and additions on the property. | Land | Improvement |
|---|---|---|---|---|
| 2025 | $21,394 | $1,784,820 | $1,249,376 | $535,444 |
| 2024 | $21,394 | $1,749,826 | $1,224,880 | $524,946 |
| 2023 | $21,029 | $1,715,518 | $1,200,864 | $514,654 |
| 2022 | $20,626 | $1,681,882 | $1,177,318 | $504,564 |
| 2021 | $20,264 | $1,648,906 | $1,154,234 | $494,672 |
| 2020 | $20,401 | $1,632,000 | $1,142,400 | $489,600 |
| 2019 | $19,704 | $1,600,000 | $1,120,000 | $480,000 |
| 2018 | $6,848 | $520,411 | $304,725 | $215,686 |
| 2017 | $6,470 | $510,208 | $298,750 | $211,458 |
| 2016 | $6,342 | $500,206 | $292,893 | $207,313 |
| 2015 | $5,296 | $411,096 | $288,494 | $122,602 |
| 2014 | $5,159 | $403,044 | $282,843 | $120,201 |
Source: Public Records
Map
Nearby Homes