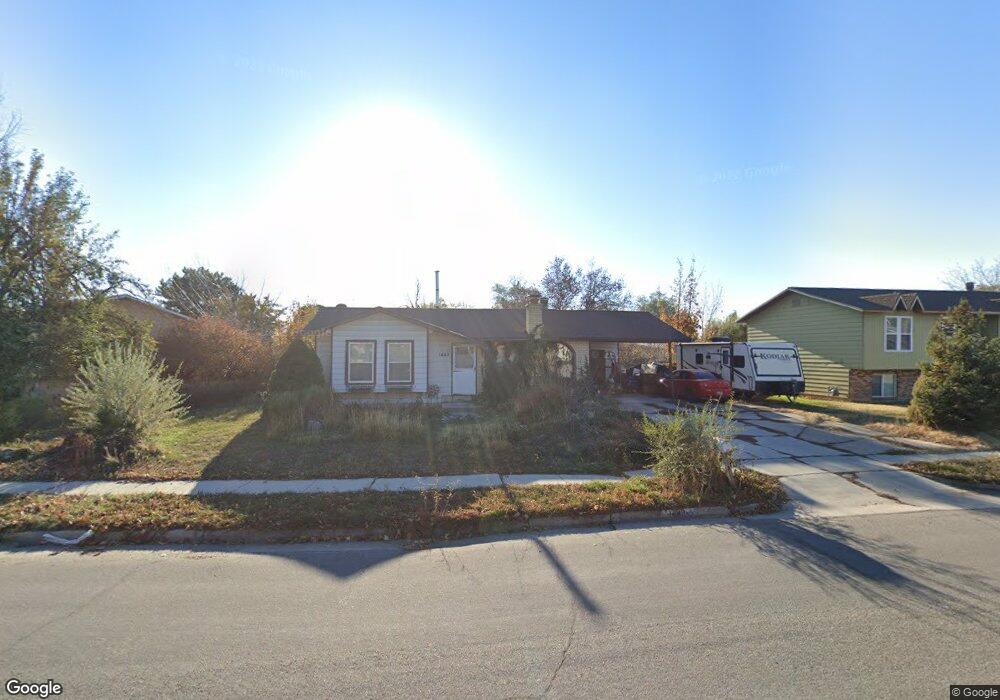
1443 N 1850 W Layton, UT 84041
Estimated Value: $398,000 - $428,000
4
Beds
2
Baths
1,870
Sq Ft
$221/Sq Ft
Est. Value
About This Home
This home is located at 1443 N 1850 W, Layton, UT 84041 and is currently estimated at $413,768, approximately $221 per square foot. 1443 N 1850 W is a home located in Davis County with nearby schools including Vae View Elementary School, Central Davis Junior High School, and Layton High School.
Ownership History
Date
Name
Owned For
Owner Type
Purchase Details
Closed on
Mar 21, 2014
Sold by
Argyle Tammy G and Argyle Merrill I
Bought by
Argyle Tammy G and Argyle Merrill I
Current Estimated Value
Purchase Details
Closed on
Sep 25, 2002
Sold by
Argyle Merrill I and Argyle Tammy G
Bought by
Argyle Tammy G and Argyle Merrill I
Home Financials for this Owner
Home Financials are based on the most recent Mortgage that was taken out on this home.
Original Mortgage
$97,094
Outstanding Balance
$40,323
Interest Rate
6.16%
Estimated Equity
$373,445
Purchase Details
Closed on
Apr 28, 1998
Sold by
Lawson Mitch L and Lawson Sherri L
Bought by
Argyle Merrill I and Argyle Tammy G
Home Financials for this Owner
Home Financials are based on the most recent Mortgage that was taken out on this home.
Original Mortgage
$81,300
Interest Rate
7.06%
Create a Home Valuation Report for This Property
The Home Valuation Report is an in-depth analysis detailing your home's value as well as a comparison with similar homes in the area
Home Values in the Area
Average Home Value in this Area
Purchase History
| Date | Buyer | Sale Price | Title Company |
|---|---|---|---|
| Argyle Tammy G | -- | First American Title | |
| Argyle Tammy G | -- | First American Title Co | |
| Argyle Merrill I | -- | First American Title Co |
Source: Public Records
Mortgage History
| Date | Status | Borrower | Loan Amount |
|---|---|---|---|
| Open | Argyle Tammy G | $97,094 | |
| Closed | Argyle Merrill I | $81,300 |
Source: Public Records
Tax History Compared to Growth
Tax History
| Year | Tax Paid | Tax Assessment Tax Assessment Total Assessment is a certain percentage of the fair market value that is determined by local assessors to be the total taxable value of land and additions on the property. | Land | Improvement |
|---|---|---|---|---|
| 2025 | $1,897 | $199,100 | $100,597 | $98,503 |
| 2024 | $1,852 | $195,800 | $120,181 | $75,619 |
| 2023 | $1,803 | $336,000 | $158,726 | $177,274 |
| 2022 | $1,945 | $196,900 | $73,912 | $122,988 |
| 2021 | $1,775 | $268,000 | $104,417 | $163,583 |
| 2020 | $1,526 | $221,000 | $76,501 | $144,499 |
| 2019 | $1,516 | $215,000 | $73,561 | $141,439 |
| 2018 | $1,313 | $187,000 | $68,112 | $118,888 |
| 2016 | $1,148 | $84,315 | $19,744 | $64,571 |
| 2015 | $1,083 | $75,515 | $19,744 | $55,771 |
| 2014 | $1,071 | $76,351 | $19,744 | $56,607 |
| 2013 | -- | $70,525 | $19,646 | $50,879 |
Source: Public Records
Map
Nearby Homes
- 1476 N 1875 W Unit 164
- 1451 N 1875 W Unit 168
- 1455 N 1875 W Unit 167
- 1523 Sherma Ave
- 1459 N 1875 W
- 1459 N 1875 W Unit 166
- 1463 N 1875 W Unit 165
- 1463 N 1875 W
- 1452 N 1875 W Unit 146
- 1479 N 1875 W
- 1479 N 1875 W Unit 161
- 1483 N 1875 W
- 1487 N 1875 W
- 1487 N 1875 W Unit 159
- 1491 N 1875 W
- 1491 N 1875 W Unit 158
- 1937 W 1620 N
- 1591 N Marilyn Dr
- 1493 Marilyn Dr
- 1219 N 1875 W