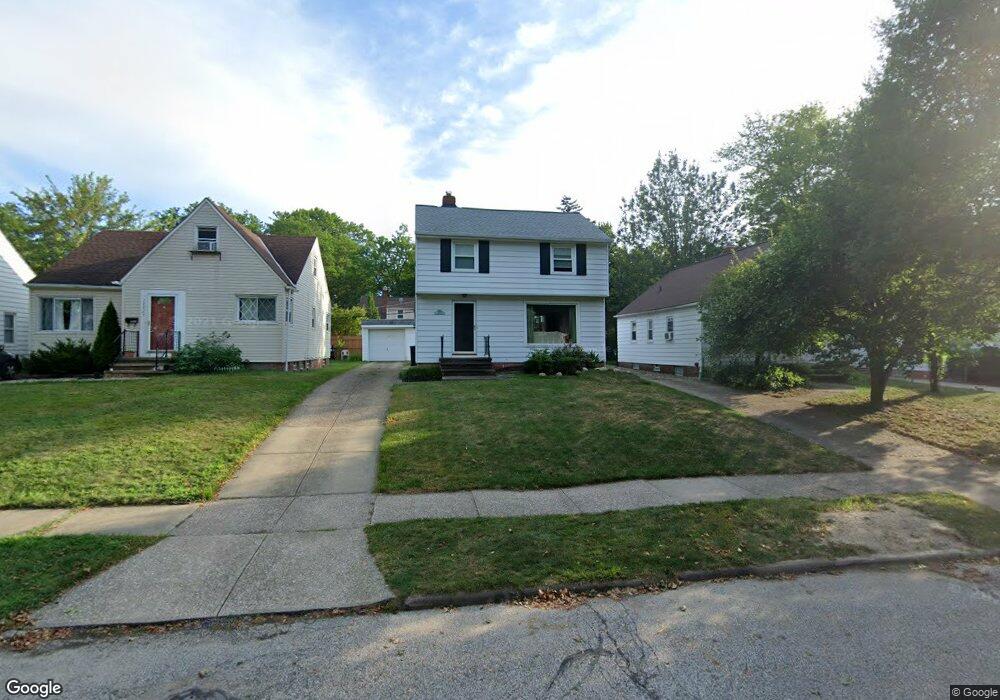
14431 Alger Rd Cleveland, OH 44111
Kamm's Corners NeighborhoodEstimated Value: $199,946 - $245,000
3
Beds
1
Bath
1,126
Sq Ft
$193/Sq Ft
Est. Value
About This Home
This home is located at 14431 Alger Rd, Cleveland, OH 44111 and is currently estimated at $216,987, approximately $192 per square foot. 14431 Alger Rd is a home located in Cuyahoga County with nearby schools including Artemus Ward School, Almira Academy, and Anton Grdina School.
Ownership History
Date
Name
Owned For
Owner Type
Purchase Details
Closed on
Jul 8, 2003
Sold by
Mcfarland Joseph L
Bought by
Biros Gene R
Current Estimated Value
Home Financials for this Owner
Home Financials are based on the most recent Mortgage that was taken out on this home.
Original Mortgage
$121,600
Interest Rate
5.36%
Mortgage Type
Purchase Money Mortgage
Purchase Details
Closed on
Aug 17, 1999
Sold by
Mcfarland Joseph L
Bought by
Mcfarland Joseph L and Mcclelland Lois
Home Financials for this Owner
Home Financials are based on the most recent Mortgage that was taken out on this home.
Original Mortgage
$94,939
Interest Rate
7.43%
Mortgage Type
FHA
Purchase Details
Closed on
Jul 14, 1999
Sold by
Cornell Mary E
Bought by
Mcfarland Joseph L
Home Financials for this Owner
Home Financials are based on the most recent Mortgage that was taken out on this home.
Original Mortgage
$94,939
Interest Rate
7.43%
Mortgage Type
FHA
Purchase Details
Closed on
Jan 1, 1975
Bought by
Cornell Mary E
Create a Home Valuation Report for This Property
The Home Valuation Report is an in-depth analysis detailing your home's value as well as a comparison with similar homes in the area
Home Values in the Area
Average Home Value in this Area
Purchase History
| Date | Buyer | Sale Price | Title Company |
|---|---|---|---|
| Biros Gene R | $128,000 | Nova Title Agency Inc | |
| Mcfarland Joseph L | -- | Nova Title Agency Inc | |
| Mcfarland Joseph L | -- | General Title Agency Inc | |
| Mcfarland Joseph L | $95,000 | -- | |
| Cornell Mary E | -- | -- |
Source: Public Records
Mortgage History
| Date | Status | Borrower | Loan Amount |
|---|---|---|---|
| Previous Owner | Biros Gene R | $121,600 | |
| Previous Owner | Mcfarland Joseph L | $94,939 |
Source: Public Records
Tax History Compared to Growth
Tax History
| Year | Tax Paid | Tax Assessment Tax Assessment Total Assessment is a certain percentage of the fair market value that is determined by local assessors to be the total taxable value of land and additions on the property. | Land | Improvement |
|---|---|---|---|---|
| 2024 | $3,655 | $55,755 | $10,395 | $45,360 |
| 2023 | $3,014 | $39,730 | $8,370 | $31,360 |
| 2022 | $2,996 | $39,730 | $8,370 | $31,360 |
| 2021 | $2,966 | $39,730 | $8,370 | $31,360 |
| 2020 | $2,639 | $30,560 | $6,440 | $24,120 |
| 2019 | $2,440 | $87,300 | $18,400 | $68,900 |
| 2018 | $2,432 | $30,560 | $6,440 | $24,120 |
| 2017 | $2,598 | $31,500 | $5,670 | $25,830 |
| 2016 | $2,577 | $31,500 | $5,670 | $25,830 |
| 2015 | $2,352 | $31,500 | $5,670 | $25,830 |
| 2014 | $2,352 | $28,640 | $5,150 | $23,490 |
Source: Public Records
Map
Nearby Homes
- 14426 Alger Rd
- 14328 Adrian Ave
- 14104 Hazelmere Ave
- 3255 W 140th St
- 14625 Grapeland Ave
- 32743 Warren Rd Unit 19
- 32742 Warren Rd Unit 18
- 2263 Warren Rd
- 3201 W 139th St
- 14608 Triskett Rd
- 14031 Lakewood Heights Blvd
- 14428 Delaware Ave
- 14315 Rainbow Ave
- 2230 Alger Rd
- 3201 Joslyn Rd
- 2209 Alger Rd
- 2233 Bunts Rd
- 14303 Tuckahoe Ave
- 14924 Delaware Ave
- 3475 W 145th St
- 14503 Alger Rd
- 14427 Alger Rd
- 14423 Alger Rd
- 14507 Alger Rd
- 14508 Birchwood Ave
- 14512 Birchwood Ave
- 14504 Birchwood Ave
- 14419 Alger Rd
- 14513 Alger Rd
- 14518 Birchwood Ave
- 14428 Birchwood Ave
- 14500 Alger Rd
- 14415 Alger Rd
- 14430 Alger Rd
- 14504 Alger Rd
- 14517 Alger Rd
- 14522 Birchwood Ave
- 14424 Birchwood Ave
- 14508 Alger Rd
- 14422 Alger Rd