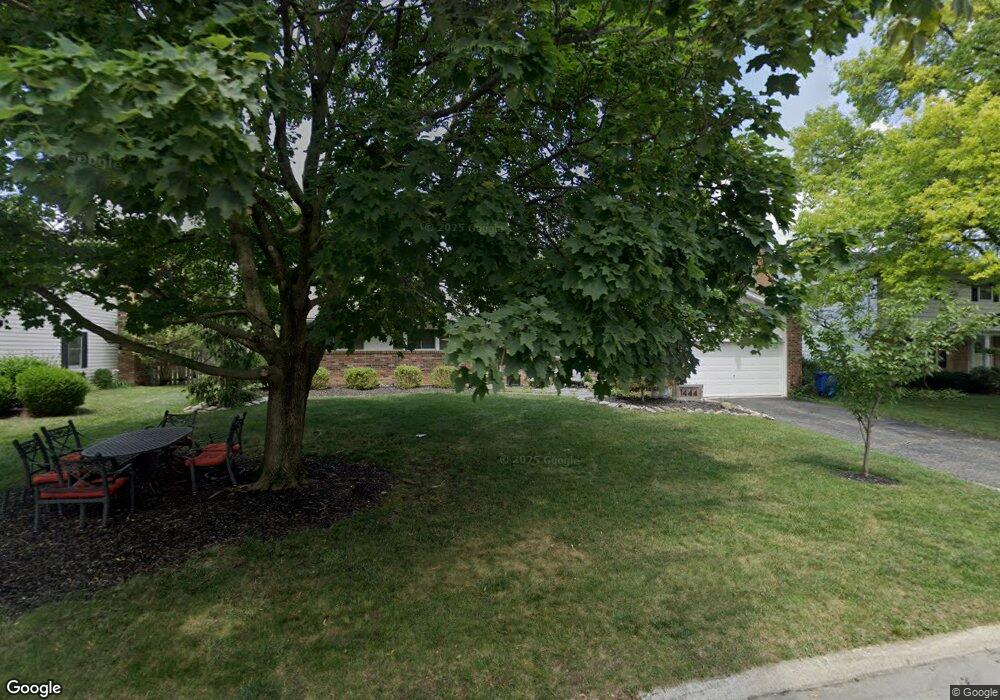
1444 Havencrest Ct Columbus, OH 43220
Governours Square NeighborhoodEstimated Value: $391,000 - $495,000
3
Beds
2
Baths
1,601
Sq Ft
$280/Sq Ft
Est. Value
About This Home
This home is located at 1444 Havencrest Ct, Columbus, OH 43220 and is currently estimated at $447,608, approximately $279 per square foot. 1444 Havencrest Ct is a home located in Franklin County with nearby schools including Winterset Elementary School, Ridgeview Middle School, and Centennial High School.
Ownership History
Date
Name
Owned For
Owner Type
Purchase Details
Closed on
Apr 1, 2020
Sold by
Chenault Daniel B and Chenault Rebecca L
Bought by
Chenault Daniel B and Chenault Rebecca L
Current Estimated Value
Home Financials for this Owner
Home Financials are based on the most recent Mortgage that was taken out on this home.
Original Mortgage
$245,000
Outstanding Balance
$204,219
Interest Rate
3.1%
Mortgage Type
New Conventional
Estimated Equity
$243,389
Purchase Details
Closed on
Jun 11, 2010
Sold by
Ewald Jane W
Bought by
Chenault Daniel B and Freund Rebecca L
Home Financials for this Owner
Home Financials are based on the most recent Mortgage that was taken out on this home.
Original Mortgage
$126,400
Interest Rate
4.97%
Mortgage Type
New Conventional
Purchase Details
Closed on
Jul 20, 1988
Bought by
Ewald Fred W and Ewald Jane W
Purchase Details
Closed on
Jul 1, 1983
Create a Home Valuation Report for This Property
The Home Valuation Report is an in-depth analysis detailing your home's value as well as a comparison with similar homes in the area
Home Values in the Area
Average Home Value in this Area
Purchase History
| Date | Buyer | Sale Price | Title Company |
|---|---|---|---|
| Chenault Daniel B | -- | Equity Settlement Svcs Inc | |
| Chenault Daniel B | $158,000 | Title First | |
| Ewald Fred W | $107,900 | -- | |
| -- | -- | -- |
Source: Public Records
Mortgage History
| Date | Status | Borrower | Loan Amount |
|---|---|---|---|
| Open | Chenault Daniel B | $245,000 | |
| Closed | Chenault Daniel B | $126,400 |
Source: Public Records
Tax History Compared to Growth
Tax History
| Year | Tax Paid | Tax Assessment Tax Assessment Total Assessment is a certain percentage of the fair market value that is determined by local assessors to be the total taxable value of land and additions on the property. | Land | Improvement |
|---|---|---|---|---|
| 2024 | $5,630 | $125,450 | $46,380 | $79,070 |
| 2023 | $5,558 | $125,440 | $46,375 | $79,065 |
| 2022 | $5,208 | $100,420 | $28,460 | $71,960 |
| 2021 | $5,218 | $100,420 | $28,460 | $71,960 |
| 2020 | $5,224 | $100,420 | $28,460 | $71,960 |
| 2019 | $4,563 | $75,220 | $28,460 | $46,760 |
| 2018 | $3,936 | $75,220 | $28,460 | $46,760 |
| 2017 | $4,107 | $75,220 | $28,460 | $46,760 |
| 2016 | $3,655 | $55,170 | $17,050 | $38,120 |
| 2015 | $3,318 | $55,170 | $17,050 | $38,120 |
| 2014 | $3,326 | $55,170 | $17,050 | $38,120 |
| 2013 | $1,562 | $52,535 | $16,240 | $36,295 |
Source: Public Records
Map
Nearby Homes
- 1424 Havencrest Ct
- 4543 Ducrest Dr
- 1512 Lafayette Dr Unit B
- 1514 Lafayette Dr Unit B
- 4714-4716 Arthur Ct
- 1594 Lafayette Dr Unit 1594
- 1610 Lafayette Dr Unit 1610
- 1360 Langston Dr
- 4818 -4820 Winterset Dr
- 1501 Bridgeton Dr
- 1466 Weybridge Rd
- 4326 Kenny Rd
- 4692 Charecote Ln Unit E
- 4924 Reed Rd Unit B
- 1033 Folkestone Rd
- 1075 Merrimar Cir N Unit B
- 1558 Denbigh Dr
- 4720 Merrifield Place Unit 67
- 5018 Paula Ct
- 1046 Merrimar Cir N Unit B
- 1436 Havencrest Ct
- 1456 Havencrest Ct
- 1443 Old Henderson Rd
- 1455 Old Henderson Rd
- 1437 Old Henderson Rd
- 4570 Winterset Dr
- 1445 Havencrest Ct
- 1435 Havencrest Ct
- 1457 Havencrest Ct
- 4590 Winterset Dr
- 1423 Old Henderson Rd
- 1412 Havencrest Ct
- 1427 Havencrest Ct
- 1465 Havencrest Ct
- 1415 Old Henderson Rd
- 1413 Havencrest Ct
- 1413 Havencrest Ct
- 4571 Winterset Dr
- 1446 Reymond Rd
- 4583 Winterset Dr