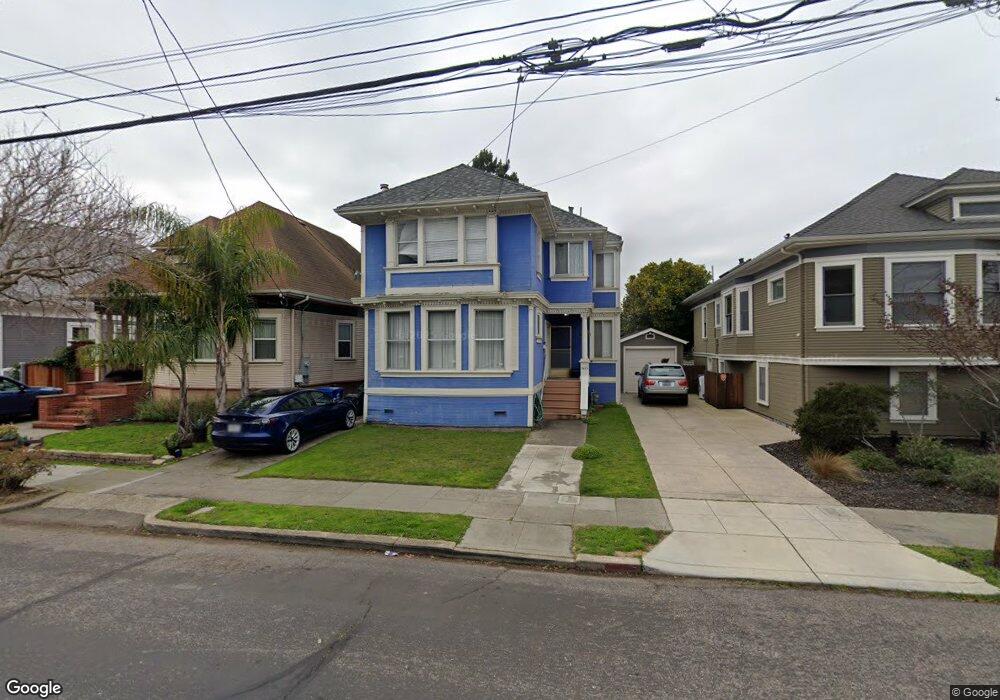
1445 6th St Alameda, CA 94501
West Alameda NeighborhoodEstimated Value: $1,067,577 - $1,301,000
3
Beds
1
Bath
1,769
Sq Ft
$673/Sq Ft
Est. Value
About This Home
This home is located at 1445 6th St, Alameda, CA 94501 and is currently estimated at $1,190,644, approximately $673 per square foot. 1445 6th St is a home located in Alameda County with nearby schools including William G. Paden Elementary School, Encinal Junior/Senior High, and The Academy of Alameda TK-8 School.
Ownership History
Date
Name
Owned For
Owner Type
Purchase Details
Closed on
Dec 27, 2012
Sold by
Lung Hsien Ta and The Shien Ta Lung & Chun Chang
Bought by
Kuo David and Lung Alice
Current Estimated Value
Purchase Details
Closed on
Jun 16, 2008
Sold by
The Hsien Ta Lung & Li Chun Chang Lung R
Bought by
The Hsien Ta Lung & Li Chun Chang Lung R
Purchase Details
Closed on
May 7, 2003
Sold by
Chang Lung Hsien Ta and Chang Lung Li Chun
Bought by
Chang Lung Hsien Ta and Chang Lung Li Chun
Home Financials for this Owner
Home Financials are based on the most recent Mortgage that was taken out on this home.
Original Mortgage
$100,000
Interest Rate
4.87%
Mortgage Type
Purchase Money Mortgage
Purchase Details
Closed on
Apr 6, 2000
Sold by
Lung Hsien T and Lung Li C
Bought by
Chang Lung Hsien Ta and Chang Lung Li Chun
Create a Home Valuation Report for This Property
The Home Valuation Report is an in-depth analysis detailing your home's value as well as a comparison with similar homes in the area
Home Values in the Area
Average Home Value in this Area
Purchase History
| Date | Buyer | Sale Price | Title Company |
|---|---|---|---|
| Kuo David | $310,000 | Old Republic Title Company | |
| The Hsien Ta Lung & Li Chun Chang Lung R | -- | None Available | |
| Chang Lung Hsien Ta | -- | Old Republic Title Company | |
| Chang Lung Hsien Ta | -- | Old Republic Title Company | |
| Chang Lung Hsien Ta | -- | -- |
Source: Public Records
Mortgage History
| Date | Status | Borrower | Loan Amount |
|---|---|---|---|
| Closed | Chang Lung Hsien Ta | $100,000 | |
| Closed | Chang Lung Hsien Ta | $132,000 |
Source: Public Records
Tax History
| Year | Tax Paid | Tax Assessment Tax Assessment Total Assessment is a certain percentage of the fair market value that is determined by local assessors to be the total taxable value of land and additions on the property. | Land | Improvement |
|---|---|---|---|---|
| 2025 | $8,373 | $517,178 | $155,153 | $362,025 |
| 2024 | $8,373 | $507,040 | $152,112 | $354,928 |
| 2023 | $8,078 | $497,098 | $149,129 | $347,969 |
| 2022 | $7,908 | $487,354 | $146,206 | $341,148 |
| 2021 | $7,728 | $477,800 | $143,340 | $334,460 |
| 2020 | $7,638 | $472,902 | $141,870 | $331,032 |
| 2019 | $7,063 | $463,633 | $139,090 | $324,543 |
| 2018 | $6,895 | $454,544 | $136,363 | $318,181 |
| 2017 | $6,599 | $445,631 | $133,689 | $311,942 |
| 2016 | $6,600 | $436,895 | $131,068 | $305,827 |
| 2015 | $6,577 | $430,335 | $129,100 | $301,235 |
| 2014 | $6,298 | $421,906 | $126,572 | $295,334 |
Source: Public Records
Map
Nearby Homes
- 2180 Barnes Wharf Ln
- 2058 Barnes Wharf Ln
- 1327 Webster St Unit B210
- 1333 Webster St Unit A107
- 1305 Webster St Unit C202
- 1321 Webster St Unit D103
- 1321 Webster St Unit D116
- 1321 Webster St Unit D119
- 1321 Webster St Unit D319
- 425 Central Ave
- 473 Pacific Ave
- 1705 5th St
- 417 Lincoln Ave
- 1527 8th St
- 308 Lincoln Ave
- 318 Cypress St Unit D
- 312 Tideway Dr
- 310 Spruce St
- 313 Spruce St
- 1834 8th St
Your Personal Tour Guide
Ask me questions while you tour the home.