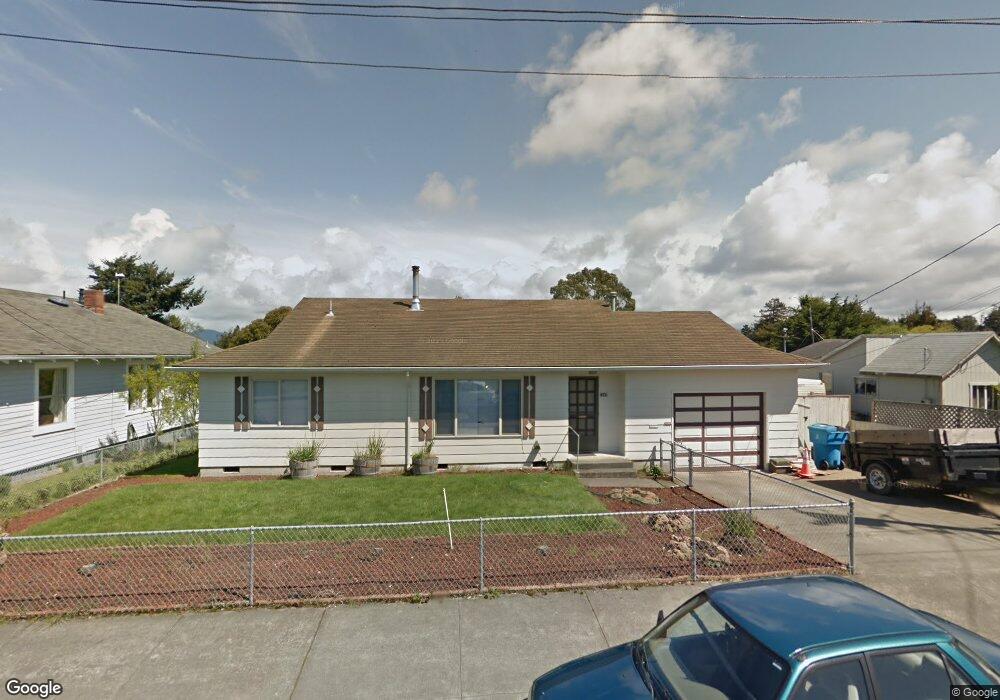
1445 East Ave Eureka, CA 95501
Buhne Street-Harrison Avenue NeighborhoodEstimated Value: $370,575 - $415,000
5
Beds
2
Baths
1,600
Sq Ft
$242/Sq Ft
Est. Value
About This Home
This home is located at 1445 East Ave, Eureka, CA 95501 and is currently estimated at $387,394, approximately $242 per square foot. 1445 East Ave is a home located in Humboldt County with nearby schools including Washington Elementary School, Catherine L. Zane Middle School, and Eureka Senior High School.
Ownership History
Date
Name
Owned For
Owner Type
Purchase Details
Closed on
May 24, 2010
Sold by
Jacques Patricia A and Alfred B Tracy Sr Inter Vivos
Bought by
Williams Jon
Current Estimated Value
Home Financials for this Owner
Home Financials are based on the most recent Mortgage that was taken out on this home.
Original Mortgage
$215,447
Outstanding Balance
$142,267
Interest Rate
4.75%
Mortgage Type
FHA
Estimated Equity
$245,127
Purchase Details
Closed on
Apr 10, 2003
Sold by
Tracy Alfred B
Bought by
Tracy Alfred B and Alfred B Tracy Sr Inter Vivos
Create a Home Valuation Report for This Property
The Home Valuation Report is an in-depth analysis detailing your home's value as well as a comparison with similar homes in the area
Home Values in the Area
Average Home Value in this Area
Purchase History
| Date | Buyer | Sale Price | Title Company |
|---|---|---|---|
| Williams Jon | $218,500 | Humboldt Land Title Company | |
| Tracy Alfred B | -- | -- |
Source: Public Records
Mortgage History
| Date | Status | Borrower | Loan Amount |
|---|---|---|---|
| Open | Williams Jon | $215,447 |
Source: Public Records
Tax History
| Year | Tax Paid | Tax Assessment Tax Assessment Total Assessment is a certain percentage of the fair market value that is determined by local assessors to be the total taxable value of land and additions on the property. | Land | Improvement |
|---|---|---|---|---|
| 2025 | $2,898 | $281,835 | $122,620 | $159,215 |
| 2024 | $2,898 | $276,310 | $120,216 | $156,094 |
| 2023 | $2,858 | $270,893 | $117,859 | $153,034 |
| 2022 | $2,967 | $265,583 | $115,549 | $150,034 |
| 2021 | $3,163 | $260,377 | $113,284 | $147,093 |
| 2020 | $2,757 | $257,708 | $112,123 | $145,585 |
| 2019 | $2,701 | $252,656 | $109,925 | $142,731 |
| 2018 | $2,751 | $247,703 | $107,770 | $139,933 |
| 2017 | $2,647 | $242,847 | $105,657 | $137,190 |
| 2016 | $2,648 | $238,086 | $103,586 | $134,500 |
| 2015 | $2,624 | $234,511 | $102,031 | $132,480 |
| 2014 | $2,453 | $229,918 | $100,033 | $129,885 |
Source: Public Records
Map
Nearby Homes
Your Personal Tour Guide
Ask me questions while you tour the home.