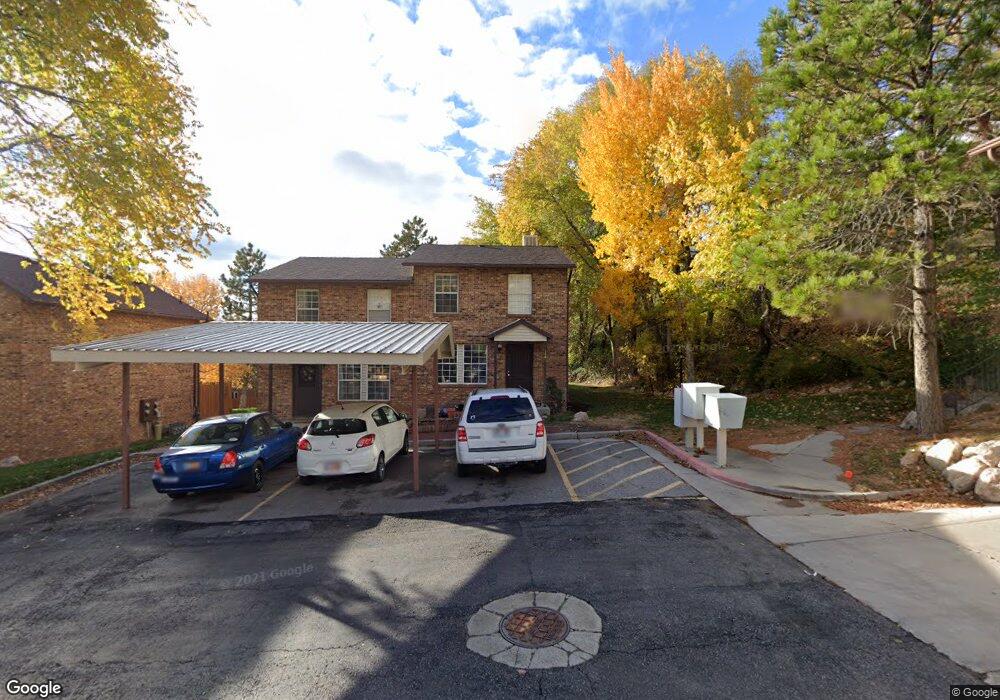
1445 S 1650 E Unit 8A Ogden, UT 84404
Horace Mann NeighborhoodEstimated Value: $285,000 - $300,000
3
Beds
2
Baths
1,674
Sq Ft
$175/Sq Ft
Est. Value
About This Home
This home is located at 1445 S 1650 E Unit 8A, Ogden, UT 84404 and is currently estimated at $293,565, approximately $175 per square foot. 1445 S 1650 E Unit 8A is a home located in Weber County with nearby schools including Mound Fort Junior High School and Ben Lomond High School.
Ownership History
Date
Name
Owned For
Owner Type
Purchase Details
Closed on
Jan 25, 2022
Sold by
Braner Brad W
Bought by
Brad W Braner Trust
Current Estimated Value
Purchase Details
Closed on
Feb 26, 2013
Sold by
Fast David T
Bought by
Braner Brad W
Purchase Details
Closed on
Sep 4, 2001
Sold by
Judd Monte and Judd Amy G
Bought by
Fast David T
Home Financials for this Owner
Home Financials are based on the most recent Mortgage that was taken out on this home.
Original Mortgage
$85,360
Interest Rate
7.05%
Mortgage Type
FHA
Purchase Details
Closed on
Aug 27, 1997
Sold by
Woodard Shirley
Bought by
Judd Monte and Judd Amy G
Home Financials for this Owner
Home Financials are based on the most recent Mortgage that was taken out on this home.
Original Mortgage
$82,000
Interest Rate
7.43%
Mortgage Type
FHA
Create a Home Valuation Report for This Property
The Home Valuation Report is an in-depth analysis detailing your home's value as well as a comparison with similar homes in the area
Home Values in the Area
Average Home Value in this Area
Purchase History
| Date | Buyer | Sale Price | Title Company |
|---|---|---|---|
| Brad W Braner Trust | -- | None Listed On Document | |
| Braner Brad W | -- | First American Title Company | |
| Fast David T | -- | Gateway Title | |
| Judd Monte | -- | Equity Title |
Source: Public Records
Mortgage History
| Date | Status | Borrower | Loan Amount |
|---|---|---|---|
| Previous Owner | Fast David T | $85,360 | |
| Previous Owner | Judd Monte | $82,000 | |
| Closed | Fast David T | $2,640 |
Source: Public Records
Tax History
| Year | Tax Paid | Tax Assessment Tax Assessment Total Assessment is a certain percentage of the fair market value that is determined by local assessors to be the total taxable value of land and additions on the property. | Land | Improvement |
|---|---|---|---|---|
| 2025 | $2,028 | $297,312 | $60,000 | $237,312 |
| 2024 | $2,084 | $300,000 | $60,000 | $240,000 |
| 2023 | $2,167 | $314,000 | $60,000 | $254,000 |
| 2022 | $2,024 | $294,000 | $60,000 | $234,000 |
| 2021 | $1,493 | $198,000 | $40,000 | $158,000 |
| 2020 | $1,306 | $160,000 | $22,000 | $138,000 |
| 2019 | $1,269 | $146,000 | $22,000 | $124,000 |
| 2018 | $1,251 | $143,000 | $22,000 | $121,000 |
| 2017 | $1,068 | $114,000 | $15,000 | $99,000 |
| 2016 | $944 | $54,450 | $8,250 | $46,200 |
| 2015 | $791 | $44,550 | $8,250 | $36,300 |
| 2014 | $716 | $39,600 | $8,250 | $31,350 |
Source: Public Records
Map
Nearby Homes
- 1677 E 1450 S
- 1695 E 1425 S
- 1372 Millcreek Dr Unit 8
- 1346 Millcreek Dr Unit 6
- 1534 Tyler Ave
- 994 Mountain Rd
- 915 Hislop Dr
- 1281 16th St
- 1277 16th St
- 1273 16th St
- 1660 Dunsinane Cir
- 1175 Canyon Rd Unit A21
- 1175 Canyon Rd Unit 77
- 1435 S 1195 E Unit 19
- 1565 E 775 S Unit 7
- 1565 E 775 S Unit 16
- 1167 16th St
- 1255 Valley Dr Unit 2
- 1120 Canyon Rd Unit 28
- 1120 Canyon Rd Unit 16
- 1445 S 1650 E
- 1447 S 1650 E
- 1453 S 1650 E Unit 7D
- 1455 S 1650 E Unit 7C
- 1650 E 1450 S Unit 22E
- 1654 E 1450 S
- 1654 E 1450 S Unit 22 A
- 1457 S 1650 E
- 1457 S 1650 E Unit 7B
- 1656 E 1450 S
- 1461 S 1650 E
- 1452 S 1650 E
- 1452 S 1650 E Unit 9A
- 1448 S 1615 E Unit 2B
- 1658 E 1450 S
- 1454 S 1650 E
- 1454 S 1650 E Unit 9B
- 1450 S 1615 E Unit 2C
- 1450 S 1615 E Unit 26
- 1458 S 1615 E Unit 4B
Your Personal Tour Guide
Ask me questions while you tour the home.