1445A 8th St Unit 2 Oakland, CA 94607
West Oakland NeighborhoodEstimated Value: $231,000 - $280,000
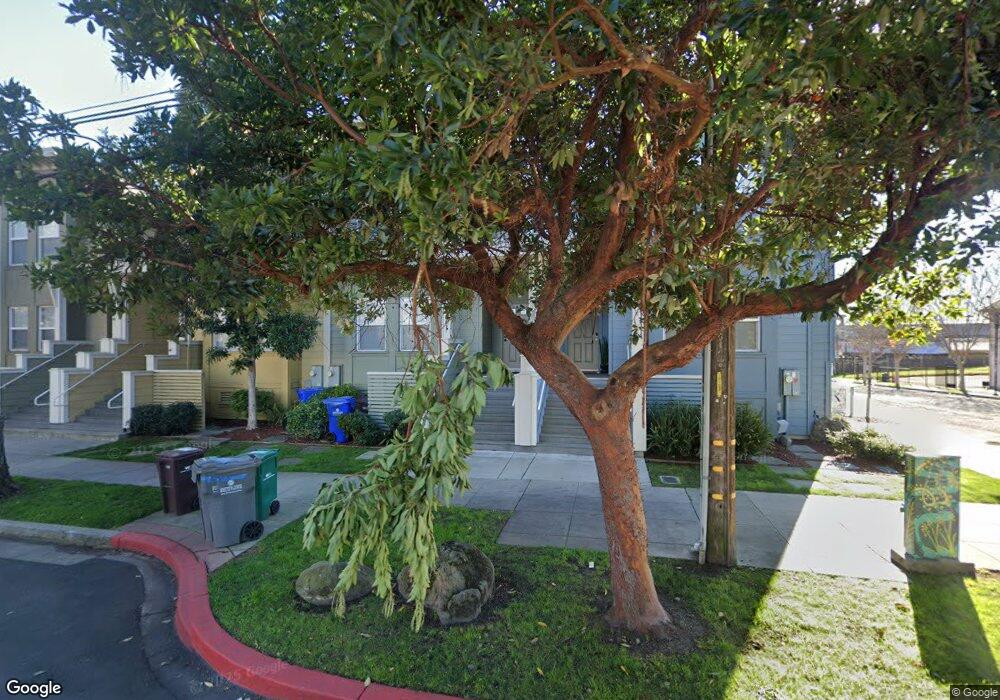
About This Home
This home is located at 1445A 8th St Unit 2, Oakland, CA 94607 and is currently estimated at $248,015, approximately $167 per square foot. 1445A 8th St Unit 2 is a home located in Alameda County with nearby schools including Prescott Elementary School, West Oakland Middle School, and McClymonds High School.
Ownership History
We collect this data history from publicly available records. To have your information removed, we recommend requesting removal directly through your county’s website.
Purchase Details
Home Financials for this Owner
Home Financials are based on the most recent Mortgage that was taken out on this home.Purchase Details
Home Financials for this Owner
Home Financials are based on the most recent Mortgage that was taken out on this home.Purchase Details
Home Values in the Area
Average Home Value in this Area
Purchase History
We collect this data history from publicly available records. To have your information removed, we recommend requesting removal directly through your county’s website.
| Date | Buyer | Sale Price | Title Company |
|---|---|---|---|
| -- | Chicago Title | ||
| $233,000 | Chicago Title | ||
| $119,500 | Chicago Title Company |
Mortgage History
We collect this data history from publicly available records. To have your information removed, we recommend requesting removal directly through your county’s website.
| Date | Status | Borrower | Loan Amount |
|---|---|---|---|
| Closed | $0 | ||
| Open | $226,010 | ||
| Closed | $0 |
Tax History
We collect this data history from publicly available records. To have your information removed, we recommend requesting removal directly through your county’s website.
| Year | Tax Paid | Tax Assessment Tax Assessment Total Assessment is a certain percentage of the fair market value that is determined by local assessors to be the total taxable value of land and additions on the property. | Land | Improvement |
|---|---|---|---|---|
| 2025 | $3,811 | $149,429 | $46,889 | $109,540 |
| 2024 | $3,641 | $146,362 | $45,970 | $107,392 |
| 2023 | $3,712 | $150,356 | $45,069 | $105,287 |
| 2022 | $3,549 | $140,408 | $44,185 | $103,223 |
| 2021 | $3,254 | $137,519 | $43,319 | $101,200 |
| 2020 | $3,215 | $143,037 | $42,875 | $100,162 |
| 2019 | $3,005 | $140,233 | $42,034 | $98,199 |
| 2018 | $2,944 | $137,485 | $41,211 | $96,274 |
| 2017 | $2,796 | $134,790 | $40,403 | $94,387 |
| 2016 | $2,619 | $132,146 | $39,610 | $92,536 |
| 2015 | $2,600 | $130,163 | $39,016 | $91,147 |
| 2014 | $2,528 | $127,614 | $38,252 | $89,362 |
Map
- 1041 7th St
- 527 Chester St
- 1416 11th St
- 355 Center St
- 1032 Peralta St
- 1128 Chester St
- 502 Lewis St
- 1137 Peralta St
- 1451 13th St Unit 5
- 1451 13th St Unit 1
- 739 Campbell St
- 731 Campbell St
- 1033 Magnolia St
- 1626 12th St
- 1032 Magnolia St
- 1212 12th St
- 1717 9th St
- 1102 10th St
- 1234 Willow St
- 1515 Center St
- 1425 8th St Unit A
- 1425 8th St Unit B
- 1411 8th St Unit A
- 1415 8th St Unit A
- 1441 8th St Unit B
- 1425B 8th St Unit 7B
- 1415A 8th St Unit 10
- 1441B 8th St Unit 3
- 1411A 8th St Unit 12
- 1431B 8th St Unit 6B
- 1415B 8th St Unit 9
- 1425A 8th St Unit 7A
- 1431A 8th St Unit 6A
- 1441A 8th St Unit 4
- 1411B 8th St Unit 11
- 1421 8th St Unit 8
- 1435 8th St Unit 5
- 1445B 8th St Unit 1
- 1422 8th St
- 1428 8th St
Ask me questions while you tour the home.