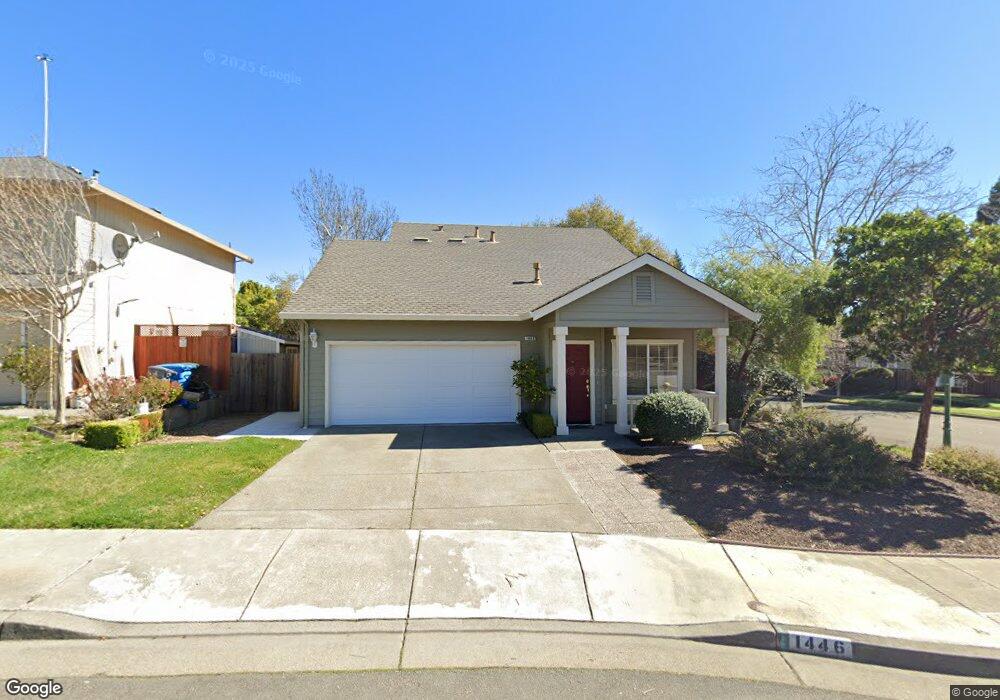
1446 Grey Hawk Way Santa Rosa, CA 95409
Skyhawk NeighborhoodEstimated Value: $699,077 - $773,000
3
Beds
3
Baths
1,299
Sq Ft
$568/Sq Ft
Est. Value
About This Home
This home is located at 1446 Grey Hawk Way, Santa Rosa, CA 95409 and is currently estimated at $738,019, approximately $568 per square foot. 1446 Grey Hawk Way is a home located in Sonoma County with nearby schools including Austin Creek Elementary School, Rincon Valley Middle School, and Maria Carrillo High School.
Ownership History
Date
Name
Owned For
Owner Type
Purchase Details
Closed on
Nov 15, 2024
Sold by
Cantu Marylou
Bought by
Cantu Marylou and Cantu Mary Lou
Current Estimated Value
Purchase Details
Closed on
Mar 6, 2007
Sold by
Wunderlich Brent V
Bought by
Wunderlich Marylou and Cantu Marylou
Purchase Details
Closed on
Feb 11, 1997
Sold by
Wunderlich Brent V and Wunderlich Mary Lou
Bought by
Wunderlich Brent V and Wunderlich Mary Lou
Purchase Details
Closed on
Sep 26, 1996
Sold by
Skyhawk Investors Parkside
Bought by
Wunderlich Brent V and Chavez Mary Lou
Home Financials for this Owner
Home Financials are based on the most recent Mortgage that was taken out on this home.
Original Mortgage
$200,171
Interest Rate
7.87%
Mortgage Type
VA
Create a Home Valuation Report for This Property
The Home Valuation Report is an in-depth analysis detailing your home's value as well as a comparison with similar homes in the area
Home Values in the Area
Average Home Value in this Area
Purchase History
| Date | Buyer | Sale Price | Title Company |
|---|---|---|---|
| Cantu Marylou | -- | None Listed On Document | |
| Cantu Marylou | -- | None Listed On Document | |
| Wunderlich Marylou | -- | None Available | |
| Wunderlich Brent V | -- | -- | |
| Wunderlich Brent V | $194,500 | North American Title Co |
Source: Public Records
Mortgage History
| Date | Status | Borrower | Loan Amount |
|---|---|---|---|
| Previous Owner | Wunderlich Brent V | $200,171 |
Source: Public Records
Tax History Compared to Growth
Tax History
| Year | Tax Paid | Tax Assessment Tax Assessment Total Assessment is a certain percentage of the fair market value that is determined by local assessors to be the total taxable value of land and additions on the property. | Land | Improvement |
|---|---|---|---|---|
| 2025 | $3,945 | $333,373 | $147,222 | $186,151 |
| 2024 | $3,945 | $326,837 | $144,336 | $182,501 |
| 2023 | $3,945 | $320,429 | $141,506 | $178,923 |
| 2022 | $3,646 | $314,147 | $138,732 | $175,415 |
| 2021 | $3,574 | $307,988 | $136,012 | $171,976 |
| 2020 | $3,561 | $304,831 | $134,618 | $170,213 |
| 2019 | $3,528 | $298,855 | $131,979 | $166,876 |
| 2018 | $4,211 | $292,996 | $129,392 | $163,604 |
| 2017 | $4,221 | $287,252 | $126,855 | $160,397 |
| 2016 | $4,181 | $281,620 | $124,368 | $157,252 |
| 2015 | $4,076 | $277,390 | $122,500 | $154,890 |
| 2014 | $3,947 | $271,957 | $120,101 | $151,856 |
Source: Public Records
Map
Nearby Homes
- 607 Scotland Dr
- 5907 Mountain Hawk Dr
- 502 Los Alamos Rd
- 676 Scotland Ct
- 5794 Owl Hill Ave
- 5769 Futura Way
- 852/848 Los Alamos Rd
- 5980 Vista Ridge
- 300 Los Alamos Rd Unit 306
- 5860 Melita Rd
- 5985 Vista Ridge
- 5974 Sunhawk Dr
- 5969 Vista Ridge
- 5741 Evening Way
- 5644 Eastlake Dr
- 5757 Futura Way
- 6017 Melita Glen Place
- 862 Wildwood Trail
- 5388 Sonoma Hwy
- 5569 Pepperwood Rd
- 1444 Grey Hawk Way
- 1427 Nighthawk Place
- 1429 Nighthawk Place
- 1442 Grey Hawk Way
- 1431 Nighthawk Place
- 1447 Grey Hawk Way
- 1449 Grey Hawk Way
- 1440 Grey Hawk Way
- 1445 Grey Hawk Way
- 1457 Great Heron Dr
- 1433 Nighthawk Place
- 1443 Grey Hawk Way
- 1455 Great Heron Dr
- 1459 Great Heron Dr
- 1438 Grey Hawk Way
- 1435 Nighthawk Place
- 1441 Grey Hawk Way
- 1438 Twilight Way
- 1440 Twilight Way
- 1458 Great Heron Dr