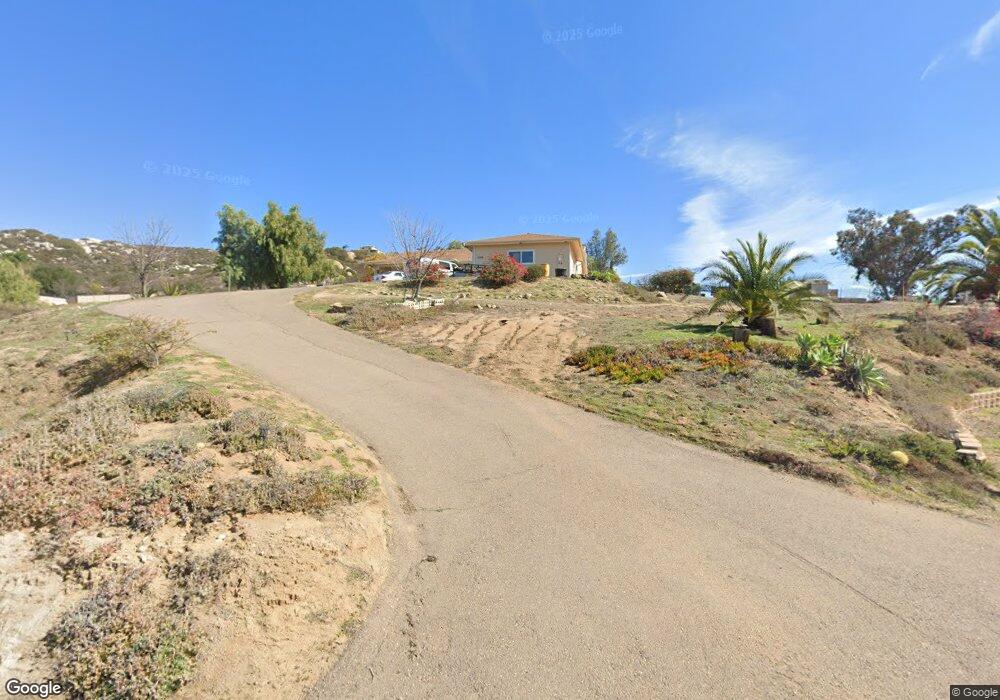
1446 Ramona View Ct Ramona, CA 92065
Estimated Value: $885,720 - $1,014,000
4
Beds
2
Baths
2,418
Sq Ft
$396/Sq Ft
Est. Value
About This Home
This home is located at 1446 Ramona View Ct, Ramona, CA 92065 and is currently estimated at $956,930, approximately $395 per square foot. 1446 Ramona View Ct is a home located in San Diego County with nearby schools including Barnett Elementary School, Olive Peirce Middle School, and Ramona High School.
Ownership History
Date
Name
Owned For
Owner Type
Purchase Details
Closed on
Jul 16, 2010
Sold by
Rahi Real Estate Holdings Llc
Bought by
Leong Wengseng and Leong Darya
Current Estimated Value
Home Financials for this Owner
Home Financials are based on the most recent Mortgage that was taken out on this home.
Original Mortgage
$349,695
Outstanding Balance
$232,261
Interest Rate
4.71%
Mortgage Type
FHA
Estimated Equity
$724,669
Purchase Details
Closed on
May 6, 2010
Sold by
Mcdaniel Troy K
Bought by
Rhai Real Estate Holdings Llc
Purchase Details
Closed on
Jun 7, 2004
Sold by
Mcdaniel Monica J
Bought by
Mcdaniel Troy K
Home Financials for this Owner
Home Financials are based on the most recent Mortgage that was taken out on this home.
Original Mortgage
$109,600
Interest Rate
7.95%
Mortgage Type
Balloon
Purchase Details
Closed on
Aug 30, 2003
Sold by
Wylie Kesner Dean and Wylie Alice W
Bought by
Pmv Construction
Create a Home Valuation Report for This Property
The Home Valuation Report is an in-depth analysis detailing your home's value as well as a comparison with similar homes in the area
Home Values in the Area
Average Home Value in this Area
Purchase History
| Date | Buyer | Sale Price | Title Company |
|---|---|---|---|
| Leong Wengseng | $380,000 | Chicago Title Company | |
| Rhai Real Estate Holdings Llc | $328,508 | Accommodation | |
| Mcdaniel Troy K | -- | First American Title | |
| Mcdaniel Troy K | $137,000 | First American Title | |
| Pmv Construction | $130,000 | Chicago Title Co |
Source: Public Records
Mortgage History
| Date | Status | Borrower | Loan Amount |
|---|---|---|---|
| Open | Leong Wengseng | $349,695 | |
| Previous Owner | Mcdaniel Troy K | $109,600 |
Source: Public Records
Tax History Compared to Growth
Tax History
| Year | Tax Paid | Tax Assessment Tax Assessment Total Assessment is a certain percentage of the fair market value that is determined by local assessors to be the total taxable value of land and additions on the property. | Land | Improvement |
|---|---|---|---|---|
| 2025 | $5,411 | $486,835 | $153,735 | $333,100 |
| 2024 | $5,411 | $477,290 | $150,721 | $326,569 |
| 2023 | $4,924 | $467,932 | $147,766 | $320,166 |
| 2022 | $5,039 | $458,758 | $144,869 | $313,889 |
| 2021 | $4,954 | $449,764 | $142,029 | $307,735 |
| 2020 | $4,907 | $445,153 | $140,573 | $304,580 |
| 2019 | $4,790 | $436,425 | $137,817 | $298,608 |
| 2018 | $4,663 | $427,868 | $135,115 | $292,753 |
| 2017 | $650 | $419,479 | $132,466 | $287,013 |
| 2016 | $4,483 | $411,255 | $129,869 | $281,386 |
| 2015 | $4,412 | $405,079 | $127,919 | $277,160 |
| 2014 | $4,311 | $397,145 | $125,414 | $271,731 |
Source: Public Records
Map
Nearby Homes
- 18434 Ramona View Dr
- 333 Salmon Rd
- VL Old Julian Hwy
- 0 Mussey Grade Rd Unit B 220023313
- 0 Mussey Grade Rd Unit C 220023312
- 0 Hwy 78 (Julian Rd) Unit SW21092588
- 161 Steffy Rd
- 18351 Woods Hill Ln
- 322 G St
- 23164 Vista Ramona Rd
- 1566 Wilson Rd
- 415 3rd St
- 539 Steffy Rd
- 1023 Olive Ave
- 19 .3 Swan Rd
- 1608 Wilson Rd
- 19075 Caesar Dr
- 1550 Keyes Rd
- 23676 Calle Ovieda
- 722 8th St
- 18407 Ramona View Dr
- 1456 Ramona View Ct
- 1536 Corte de Powell
- 1432 Ramona View Ct
- 18405 Ramona View Dr
- 1411 Highway 78
- 1411 Highway 78
- 18403 Ramona View Dr
- 231 Woodmeadow Ln
- 1370 Ramona View Ct
- 18452 Paseo Pantera
- 267 Woodmeadow Ln
- 1358 Ramona View Ct
- 18486 Paseo Pantera
- 266 Woodmeadow Ln
- 230 Salmon Rd
- 1334 Ramona View Ct
- 255 Elizabeth Ln
- 18411 Ramona View Dr
- 0 Paseo Pantera Unit 1018993 240005996